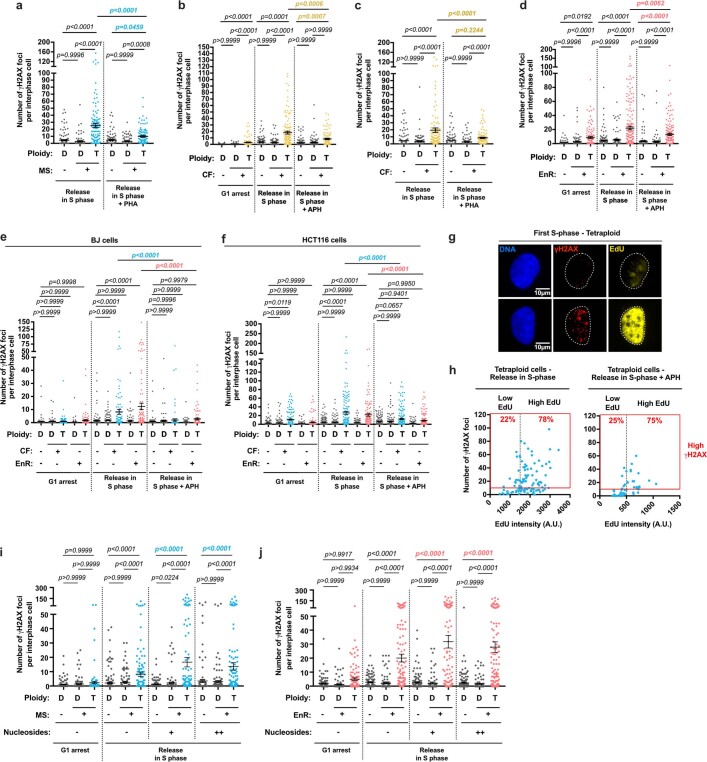
Extended Data Fig. 5. DNA damage in newly born tetraploid cells is generated in a DNA replication-dependent manner.
(a) γH2AX foci number in diploid and tetraploid RPE-1 cells released in S-phase ± 1 µM PHA. Mean ± SEM, >100 interphase cells were analyzed from at least three independent experiments. (b–c) γH2AX foci number in diploid and tetraploid RPE-1 cells, arrested in G1 using 1 µM palbociclib or released in S-phase ± 400 nM aphidicolin (APH) (b) or 1 µM PHA (c). Mean ± SEM, >100 interphase cells were analyzed from at least three independent experiments. (d) γH2AX foci number in diploid and tetraploid RPE-1 cells released in S-phase ± 400 nM APH. Mean ± SEM, >100 interphase cells were analyzed from at least three independent experiments. (e–f) γH2AX foci number in diploid and tetraploid BJ (e) or HCT116 (f) cells, released in S-phase ± 400 nM APH. Mean ± SEM, >100 interphase cells were analyzed from at least three independent experiments. (g) Images showing EdU ± tetraploid RPE-1 cells. γH2AX antibodies in red, EdU in yellow and DNA in blue. (h) γH2AX foci number relative to EdU intensity in RPE-1 tetraploid cells released in S-phase untreated (left panel) or treated (right panel) with 400 nM aphidicolin (APH). Mean ± SEM, >100 interphase cells were analyzed from at least three independent experiments. (i, j) γH2AX foci number in diploid and tetraploid cells (i, blue) or EnR (j, red), synchronized in G1 using 1 µM palbociclib or released in S-phase ±nucleosides at two different concentrations (methods). Mean ± SEM, >100 interphase cells were analyzed from at least three independent experiments. The dotted lines indicate the nuclear area. ANOVA test (one-sided) (a, b, c, d, e, f, i and j). Pearson test (two-sided) (h).

