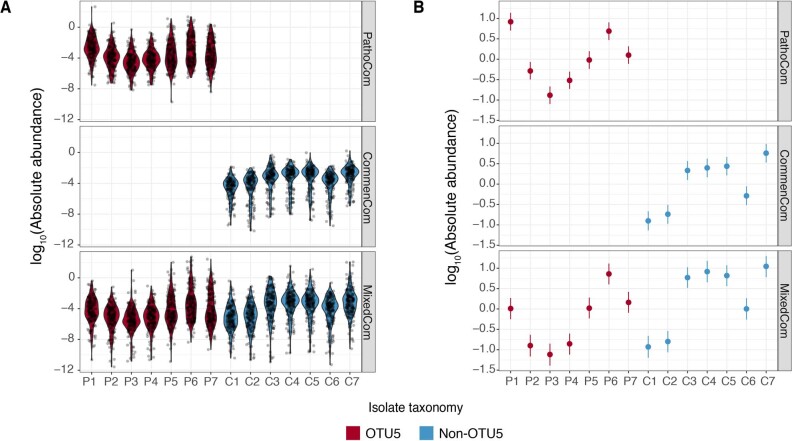
Extended Data Fig. 6. Load of each isolate in plants infected with PathoCom, CommenCom or MixedCom, 12 days post infection.
a. Raw data. b. The estimated abundance of each isolate, derived from the model [log10(isolate load) ~ isolate]. Each treatment was analysed separately, thus the model was used for the subset of each treatment. Dots indicate the median estimates, and vertical lines 95% Bayesian credible intervals of the fitted parameter. n=170 for PathoCom, n=151 for CommenCom, and n=182 for MixedCom.

