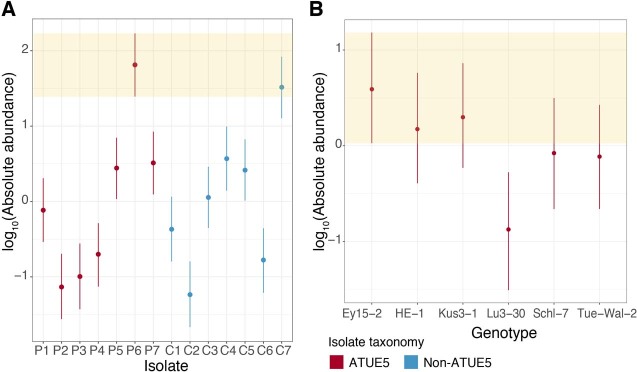
Extended Data Fig. 10. The abundance of P6 in MixedCom-infected hosts.
a. Abundance of P6 compared with the other 13 barcoded bacteria in MixedCom-infected hosts, for all host genotypes. Dots indicate the median estimates, and vertical lines 95% Bayesian credible intervals of the fitted parameter, following the model [log10(isolate load) ~ isolate * experiment + isolate + experiment + error]. Shaded area denotes the 95% Bayesian credible interval of the isolate P6. b. The abundance of P6 in MixedCom-infected hosts, compared between the six A. thaliana genotypes used. Dots indicate the median estimates, and vertical lines 95% Bayesian credible intervals of the fitted parameter, following the model [log10(isolate load) ~ genotype * experiment + genotype + experiment + error]. Shaded area denotes the 95% Bayesian credible interval of the host genotype Ey15-2.

