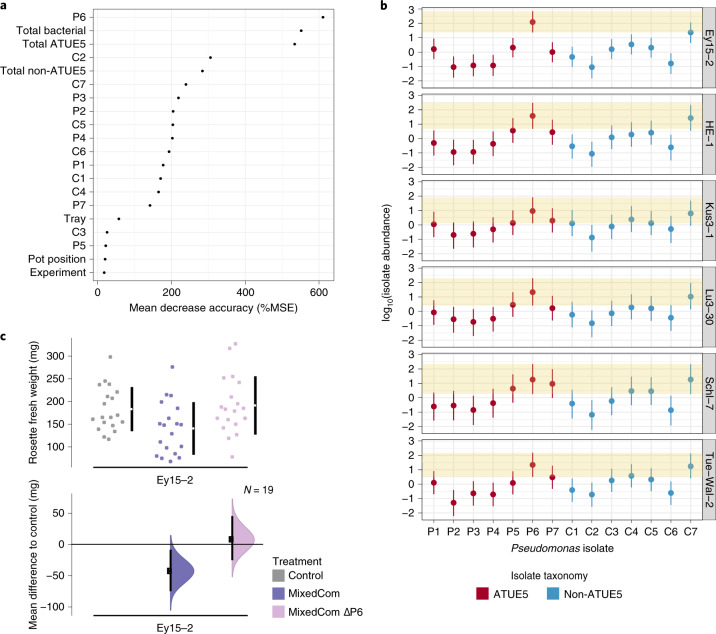
Fig. 6. The effect of isolate P6 on weight in MixedCom-infected hosts and particularly on accession Ey15-2.
a, Relative importance (mean decrease accuracy; ‘MSE’) of 20 examined variables in weight prediction of MixedCom-infected hosts as determined by Random Forest analysis. The best predictor was the abundance of isolate P6. ‘Total bacterial’, ‘Total ATUE5’ and ‘Total non-ATUE5’ indicate the cumulative abundances of the 14 isolates, seven ATUE5 isolates and seven non-ATUE5 isolates, respectively. b, Abundance of P6 compared with the other 13 barcoded isolates in MixedCom-infected hosts across the six A. thaliana genotypes used in this study. Dots indicate the median estimates, and vertical lines represent 95% Bayesian credible intervals of the fitted parameter, following the model [log10(isolate load) ~ isolate × experiment + isolate + experiment + error]. Each genotype was analysed individually, thus the model was utilized for each genotype separately. The shaded area denotes the 95% Bayesian credible intervals for the isolate P6. c, Fresh rosette weight of Ey15-2 plants treated with Control, MixedCom and MixedCom without P6 (MixedCom ΔP6). Fresh rosette weight was measured 12 DPI. The top panel presents the raw data, with the breaks in the vertical black lines denoting the mean value of each group, and the vertical lines indicating standard deviation. The lower panel presents the mean difference to control, plotted as bootstrap sampling55,56, indicating the distribution of effect size that is compatible with the data. The 95% confidence intervals are indicated by the black vertical bars, and n = 19.

