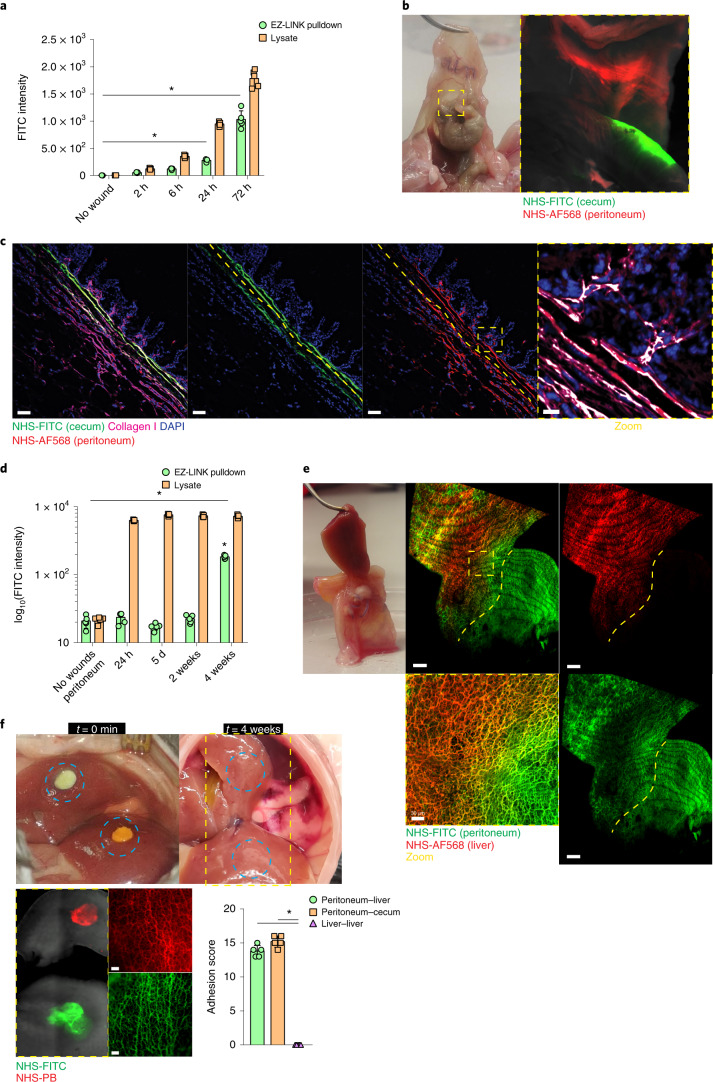
Fig. 2. Transferred matrix regenerates connective tissues in wounds.
a, Fluoreometric analysis of samples derived from liver wounds distantly labeled with EZ-LINK-biotin and NHS-FITC at 2, 6, 24 and 72 hours p.i.; uninjured tissue acted as control. Data represent mean ± s.d. Two-tailed Mann–Whitney: *P < 0.05. n = 4 biological replicates (C57BL/6J WT mice) and 3 independent experiments. b, Representative images of a postoperative adhesion site between peritoneum (NHS-AF568+) and cecum (NHS-FITC+) at 4 weeks p.i. Both organs were locally labeled and brushed at distal sites opposing each other. n = 5 biological replicates (C57BL/6J WT mice) and 4 independent experiments. c, Representative immunolabel images of a postoperative adhesion site between peritoneum (NHS-AF568+) and cecum (NHS-FITC+) at 4 weeks p.i. Both organs were locally labeled and brushed at distal sites opposing each other. n = 5 biological replicates (C57BL/6J WT mice) and 4 independent experiments. Scale bars: overview, 100 µm; zoom, 10 µm. d, Fluoreometric analysis of samples derived from adhesion samples between peritoneum (EZ-LINK-biotin+) and cecum (NHS-FITC+) at 24 hours, 5 days, 2 weeks and 4 weeks p.i.; uninjured peritoneum acted as control. Data represent mean ± s.d. Two-tailed Mann–Whitney; *P < 0.05. n = 5 biological replicates (C57BL/6J WT mice) and 3 independent experiments. e, Representative images of a postoperative adhesion site between peritoneum (NHS-FITC+) and liver (NHS-AF568+) at 4 weeks p.i. Both organs were locally labeled and brushed at distal sites opposing each other. n = 5 biological replicates (C57BL/6J WT mice) and 4 independent experiments. Scale bars: overview, 200 µm; zoom, 20 µm. f, Representative images of NHS-FITC+ and NHS-PB+ liver lobes with opposing wound sites at 4 weeks p.i. n = 5 biological replicates (C57BL/6J WT mice) and 3 independent experiments. Scale bar, 50 µm. Intraorgan adhesions were scored according to Supplementary Table 1. Data represent mean ± s.d. Two-tailed Mann–Whitney: *P < 0.05.

