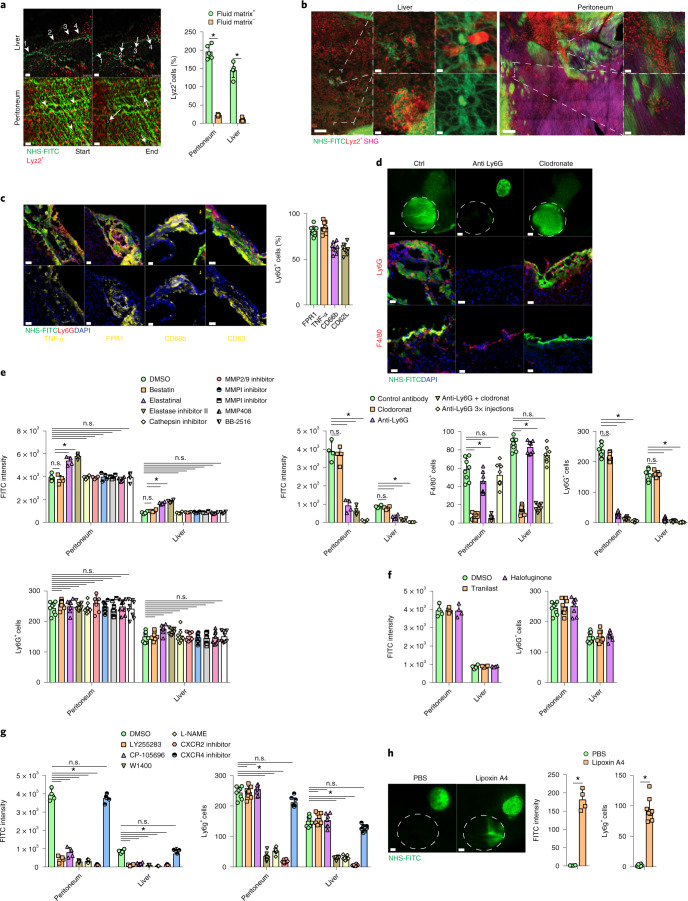
Fig. 4. Active neutrophils actively transport matrix by swarming.
a, Snapshots of Supplementary Movies 7 and 8: Lyz2+ (red) cells on liver are shown, and peritoneal surfaces single cells are highlighted with arrows. n = 5 biological replicates and 3 independent experiments. Two-tailed Mann–Whitney: *P < 0.05. Scale bars, 50 µm. b, Representative images of NHS-FITC-labeled liver and peritoneal surfaces in Lyz2Cre;Ai14 mice at 24 hours p.i. n = 5 biological replicates and 3 independent experiments. Scale bars: overview, 50 µm; zoom, 5 µm. c, Representative images showing the ratio of TNF-α+, FPR1+, CD63+, CD62L+ and CD66b+ and Ly6G+ neutrophils in wound areas at 24 hours p.i. n = 6 biological replicates (all C57BL/6J WT mice) and 4 independent experiments. Scale bar: 50 µm. d, Representative images from liver surfaces of animals treated with anti-Ly6G antibody or clodronate marked with NHS-FITC at 24 hours p.i. n = 5 biological replicates (all C57BL/6J WT mice) and 3 independent experiments. Two-tailed Mann–Whitney: *P < 0.05. Scale bars: overview, 500 µm; histology, 30 µm. e–g, Fluorometric measurements of transferred FITC+ matrix in wounds in animals treated with protease (e), collagen-synthesis (f) or neutrophil-swarming inhibitors (g) at 24 hours p.i. Quantification of Ly6G+ cells in wounds at 24 hours p.i. n = 5 biological replicates (all C57BL/6J WT mice) and 3 independent experiments. Two-tailed Mann–Whitney: *P < 0.05. h, Representative images from liver surfaces of animals locally treated with lipoxin 4A marked with NHS-FITC at 24 hours p.i. Quantification of Ly6G+ cells in wounds at 24 hours p.i. n = 4 biological replicates (all C57BL/6J WT mice) and 4 independent experiments. Two-tailed Mann–Whitney: *P < 0.05. Scale bar: overview, 500 µm.

