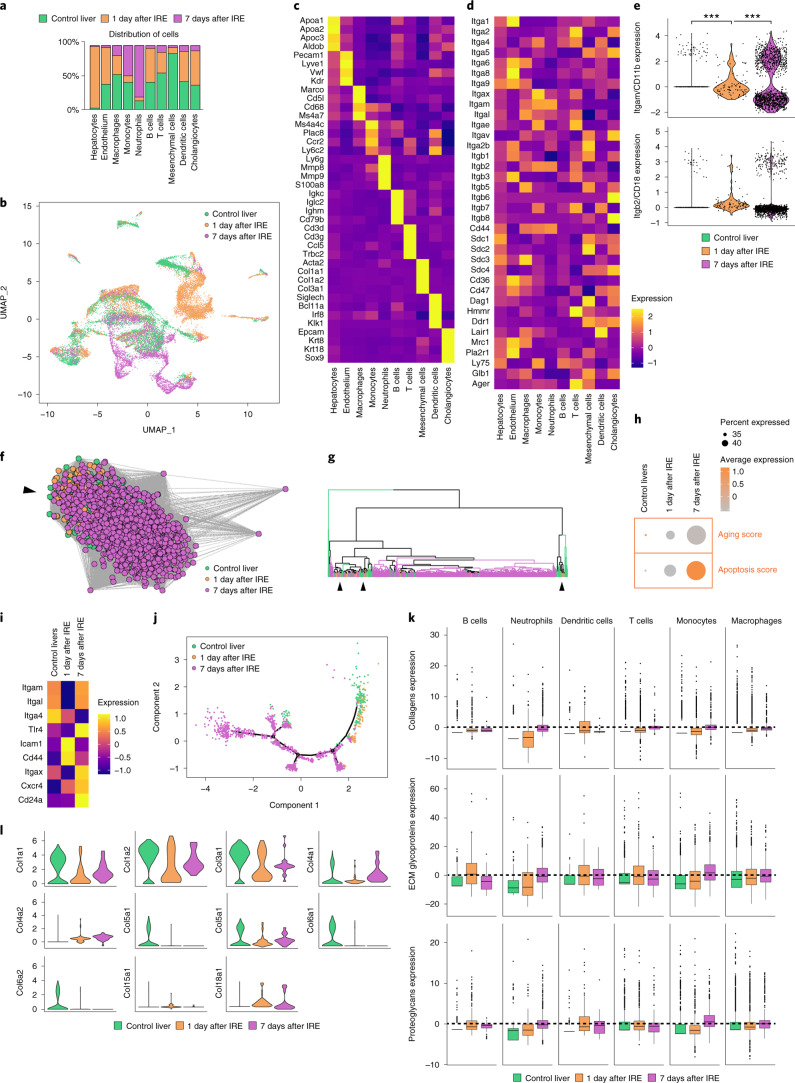
Fig. 5. Single-cell transcriptomics of liver wounds identifies 17 major cellular lineages.
a, Single-cell sequencing data of adult mouse livers subjected to irreversible electroporation, showing distribution of cells per cluster, colored by experimental condition. b, UMAP of a. c, Scaled heatmap (yellow, high; purple, low) of cell-lineage markers used to identify the different cell populations. d, Scaled heatmap (yellow, high; purple, low) of all ECM receptors expressed in the different liver lineages. e, Violin plots showing the expression of Itgb2 and Itgam in the neutrophil cluster. Two sample t-test. f, Inferred lineage relationship among neutrophils in an adjacency network on the basis of pairwise correlations between cells. Black arrow indicates point of heterogeneity. g, Hierarchical clustering on neutrophilic genes identified by principal component analysis (PCA). Black arrows indicate points of heterogeneity. h, Aging and apoptosis score based on the total expression of age-related genes (listed in d) and apoptosis genes (GO:0097193). i, Scaled heatmap (yellow, high; purple, low) of all age-related genes (see Methods). j, Monocle pseudotemporal ordering based on genes identified by PCA revealing neutrophilic maturation. k, Cumulative expression score of genes that fall under the core matrisome, further categorized into collagens (top), glycoproteins (middle) and proteoglycans (bottom). l, Mesenchyme cell cluster, showing gene expressions (violin plots) of all collagens exceeding an expression threshold of 2.0. ***P < 0.001. Box plots represent the median, interquartile range (IQR), minimum (25th percentile, 1.5 × IQR) and maximum (75th percentile, 1.5 × IQR).

