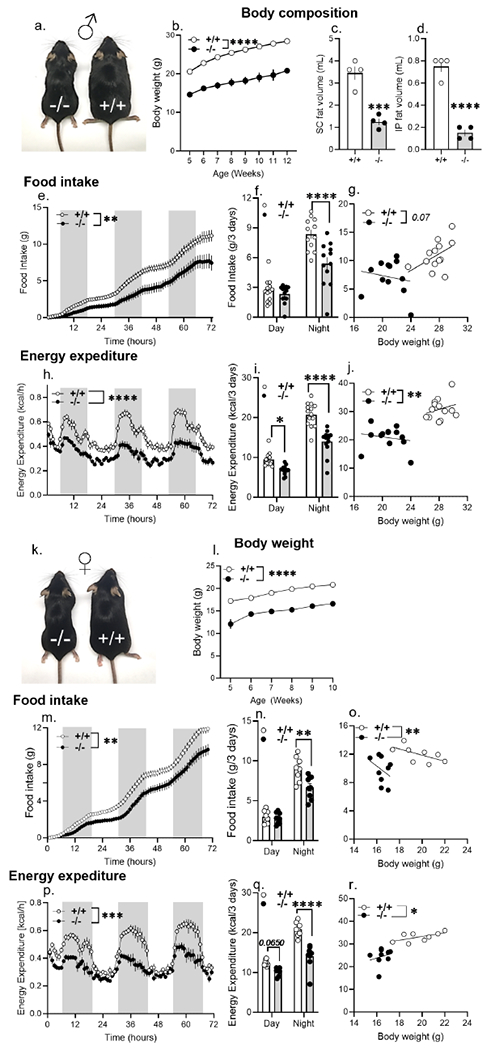
Figure 2. Ptprd ablation phenocopies the body weight and orexigenic deficits associated with genetic asprosin deficiency and pharmacologic asprosin inhibition.

(a) A representative photograph of 5-month-old male Ptprd+/+ and Ptprd−/− littermates (n=1 photograph from n = 3 mice per genotype).
(b) Weekly body weights of wildtype (Ptprd+/+, n = 25) and Ptprd null (Ptprd−/−, n = 11) male mice from 5- to 12-weeks of age.
(c-d) Body composition data using Magnetic Resonance Imaging (MRI) on 5-month-old Ptprd+/+ and Ptprd−/− male mice on normal chow (n = 4/group).
(e-g) Cumulative food intake (e), total food intake in the dark and light phase (f), and ANCOVA analysis (g) of total food intake of Ptprd+/+ and Ptprd−/− male mice measured over 3 days using the Promethion metabolic system (n=12 or 13/group).
(h-j) Hourly energy expenditure (h) total energy expenditure in the light and dark phase (i), and ANCOVA analysis (j) of energy expenditure of Ptprd+/+ and Ptprd−/− male mice measured over 3 days using the Promethion metabolic system (n = 13/group).
(k) A representative photograph of 6-month-old female Ptprd+/+ and Ptprd−/− littermates (n=1 photograph from n = 3 mice per genotype).
(l) Weekly body weights of wildtype (Ptprd+/+, n = 16) and Ptprd null (Ptprd−/−, n = 11) female mice from 5- to 10-weeks of age.
(m-o) Cumulative food intake (m), total food intake in the dark and light phase (n), and ANCOVA analysis (o) of total food intake of Ptprd+/+ (n = 8) and Ptprd−/− (n = 9) female mice measured over 3 days using Promethion metabolic system.
(p-r) Hourly energy expenditure (p) and total energy expenditure in the light and dark phase (q), and ANCOVA analysis (r) of energy expenditure of Ptprd+/+ (n = 8) and Ptprd−/− (n = 9) female mice measured over 3 days using the Promethion metabolic system.
*P < 0.05, **P < 0.01, ***P < 0.001 and ****P < 0.0001; ‘effect of genotype’ determined by two-tailed Student’s t-test (c,d,f,i,n,q), Repeated measures two-way ANOVA (b,e,h,l,m,p) or ANCOVA (g,j,o,r). Data are represented as mean ± SEM. See also Figure S1, S2, S3 and S4.
