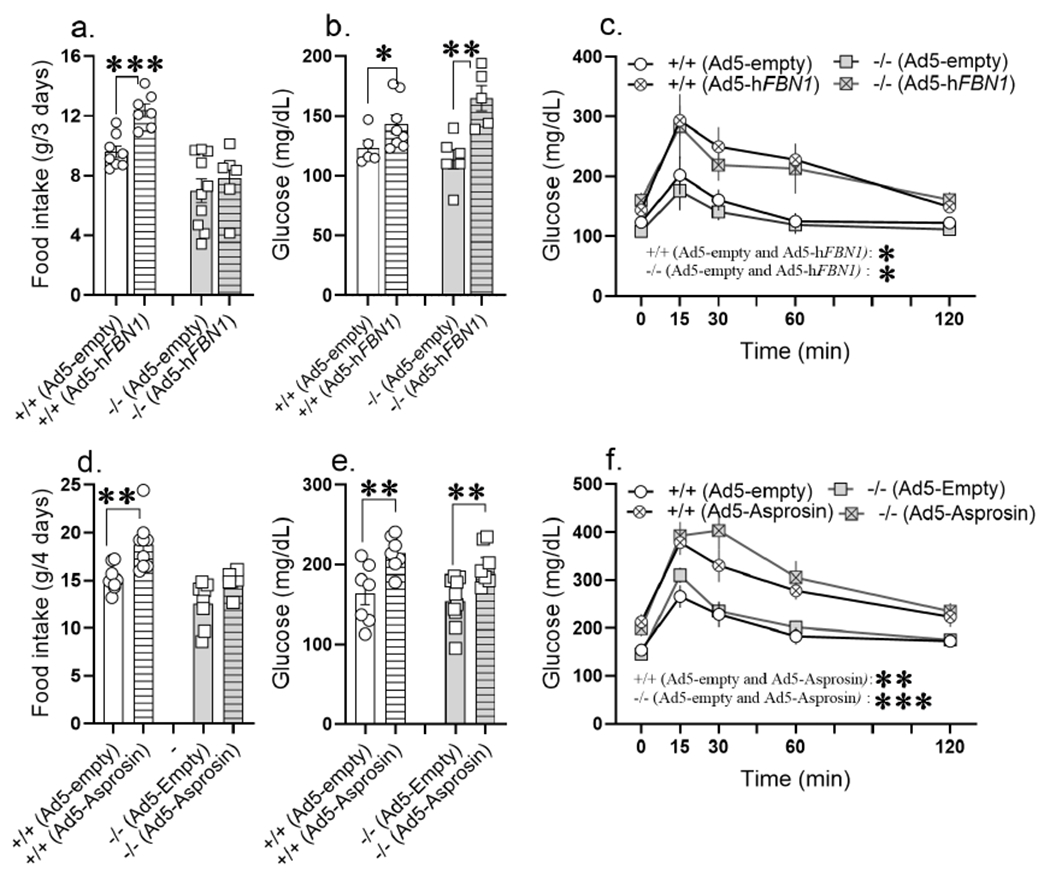
Figure 5. Ptprd−/− mice are unresponsive to the orexigenic effects of asprosin while responding normally to its glucogenic effects.

(a-c) 14-week-old normal chow fed Ptprd+/+ and Ptprd−/− male mice tail-vein transduced with Ad-empty or Ad-hFBN1 (3.6 x 10⁹ pfu/mouse) viruses. (a) Cumulative food intake measured in Promethion metabolic chamber over 3 days; day 8 to day 11 post adenoviral vector transduction (Ad-empty: n = 8 Ptprd+/+ and n = 10 Ptprd−/−; Ad-hFBN1: n = 7 Ptprd+/+ and n = 6 Ptprd−/−. (b,c) ad libitum fed baseline blood glucose levels and glucose tolerance assay in response to intraperitoneal glucose injection (2mg/kg) on day 14 post adenoviral transduction (baseline glucose: Ad-empty: n = 5 Ptprd+/+ and n = 6 Ptprd−/−; Ad-hFBN1: n = 8 Ptprd+/+ and n = 6 Ptprd−/−, GTT: Ad-empty: n = 5 Ptprd+/+ and n = 4 Ptprd−/−; Ad-hFBN1: n = 7 Ptprd+/+ and n = 4 Ptprd−/−).
(d-f) 12-week-old normal chow fed Ptprd+/+ and Ptprd−/− male mice tail-vein transduced with Ad-empty or Ad-hAsprosin (5 x 10¹⁰ pfu/mouse) viruses. (d) Cumulative food intake measured in promethion metabolic chamber over 4 days; day 8 to day 12 post adenoviral vector transduction (Ad-empty: n = 8 Ptprd+/+ and n = 8 Ptprd−/−; Ad-hAsprosin: n = 9 Ptprd+/+ and n = 6 Ptprd−/−. (e,f) ad libitum fed baseline blood glucose levels and glucose tolerance assay (GTT) in response to intraperitoneal glucose injection (2mg/kg) on day 15 post adenoviral transduction (Ad-empty: n = 7 Ptprd+/+ and n = 10 Ptprd−/−; Ad-hAsprosin1: n = 7 Ptprd+/+ and n = 7 Ptprd−/−).
*P < 0.05, **P < 0.01, ***P < 0.001 and ****P < 0.0001; by two-tailed Student’s t-test (a,b,d,e), and repeated measures two-way ANOVA (c,f). Data are represented as mean ± SEM. See also Figure S8.
