
Figure 5. Metabolomic profiling and biochemical-immunological validation of PRODH2 GOF CAR-Ts.
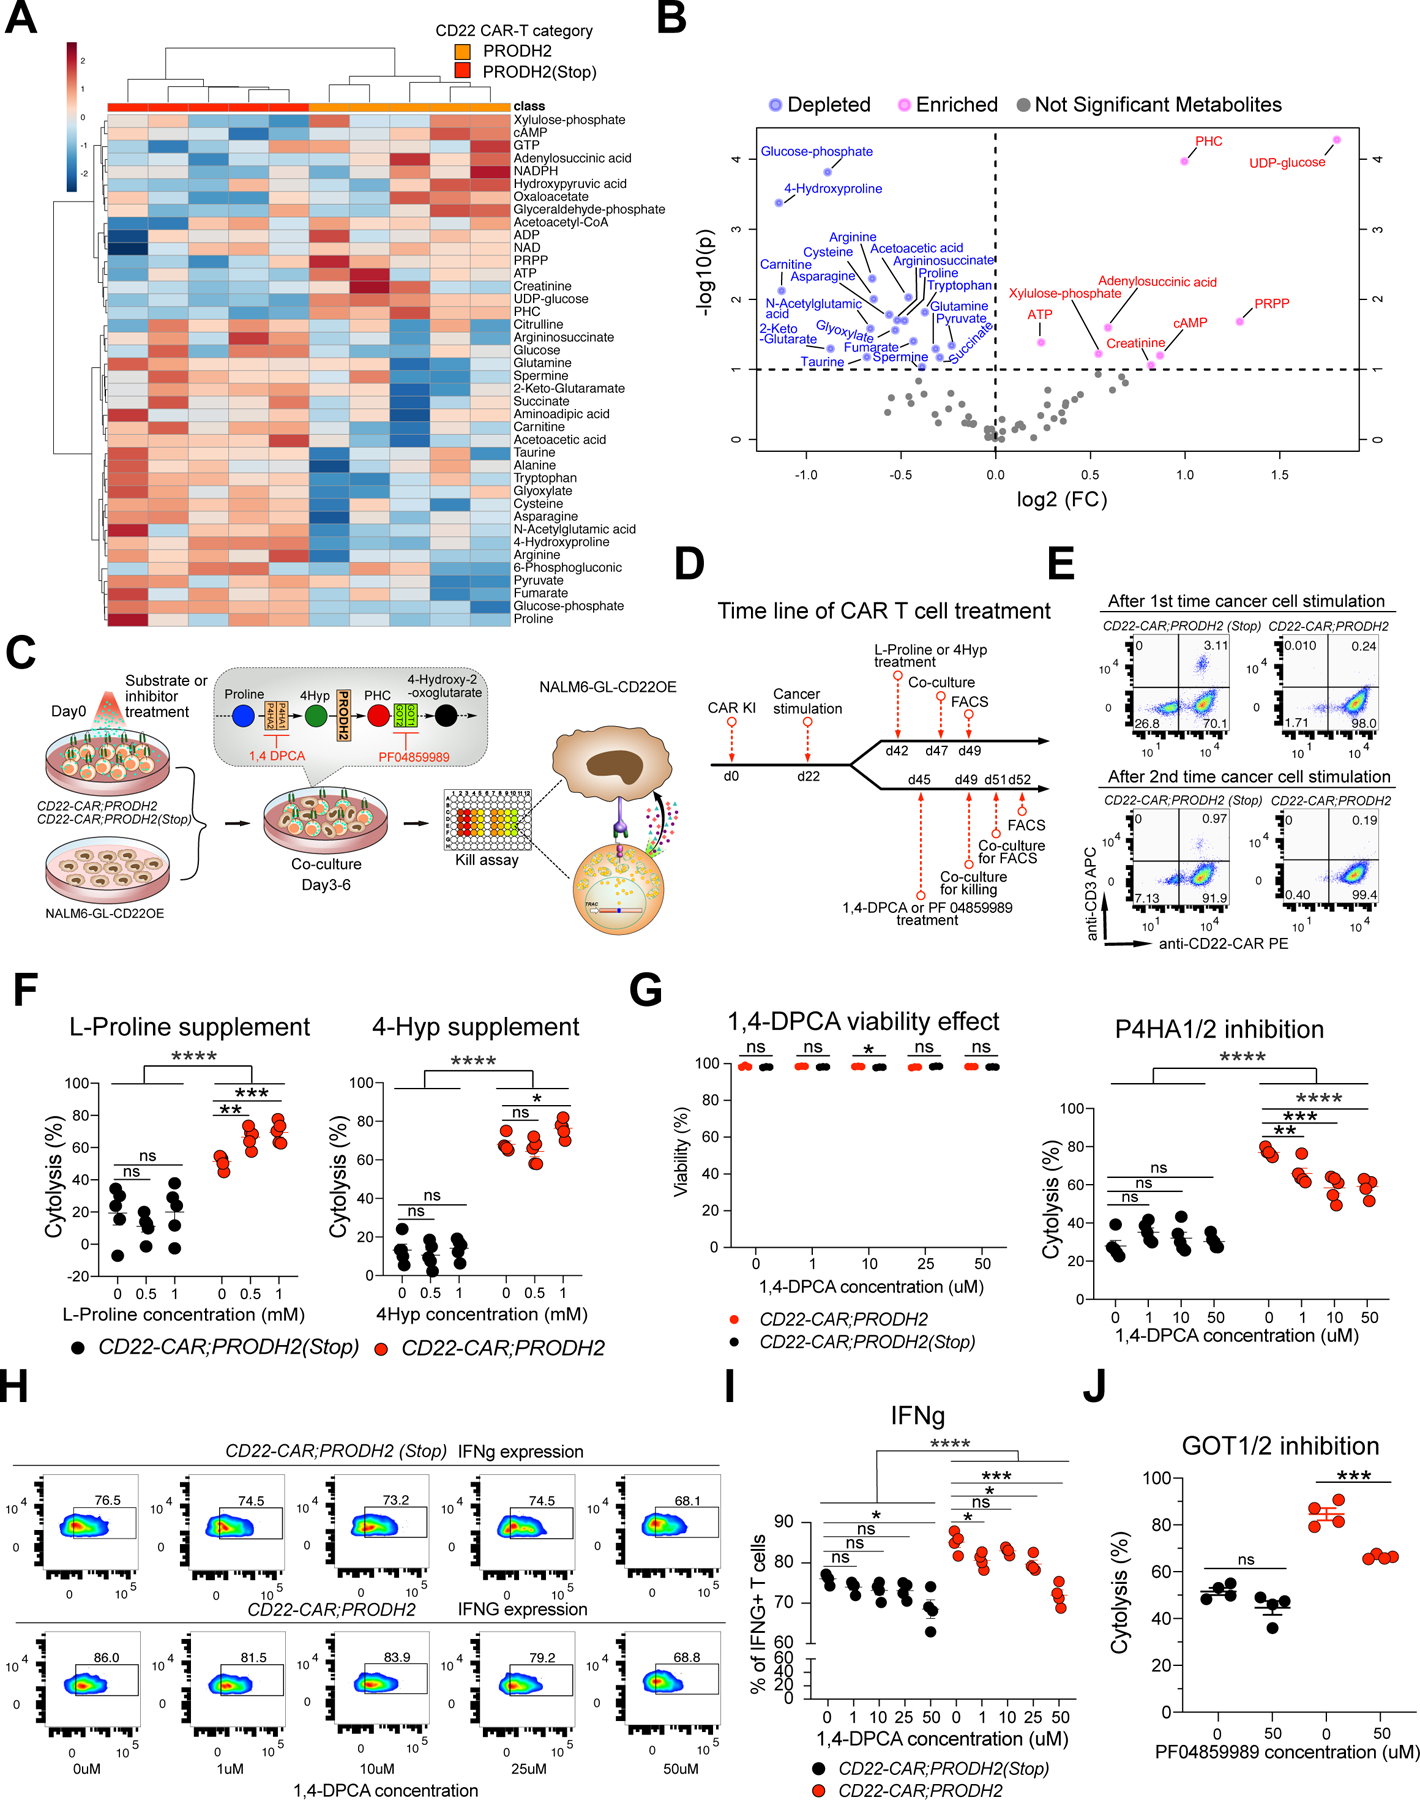
(A) Heatmap of the relative abundance of top 40 QTOF/QQQ detected metabolites of PRODH2 vs. PRODH2(Stop) CD22-CAR-T cells (n = 5 biological replicates). Representative data from two independent experiments.
(B) Volcano plot of differentially represented (DR) metabolites between PRODH2 vs. PRODH2(Stop) CD22-CAR-T cells. Blue dots indicate decreased metabolites, pink dots indicate increased metabolites.
(C) Schematic of biochemical-immunological validation of PRODH2 GOF CAR-Ts, including chemical compound treatment, co-culture and flow cytometry. CAR-T cells were supplied with extra L-proline (substrate for P4HA1 and P4HA2), 4-hydroxyproline (4Hyp, substrates for PRODH2), or 1,4-DPCA (inhibitor of P4HA1 and P4HA2), PF 04859989 (inhibitor of GOT1 and GOT2) before co-culture and flow cytometry analyses.
(D) Timeline of CAR-T cell treated with L-Proline, 4Hyp, 1,4-DPCA, and PF 04859989, co-culture, and FACS.
(E) Representative CAR KI percentages after 1st and 2nd cancer stimulations. Representative data from two independent experiments.
(F) Substrate supplement experiment. Cytolytic activity measurement by co-culture of CD22-CAR;PRODH2 and CD22-CAR;PRODH2 (Stop) T cells with NALM6-GL-CD22OE cancer cells for 6h after T cells pre-treated with different concentration of L-Proline and 4Hyp.
(G) P4HA enzymatic inhibition experiment. (Left) DPCA toxicity analysis. Cell viability measurement of CD22-CAR;PRODH2 and CD22-CAR;PRODH2 (Stop) T cells after treating with different concentration of 1,4-DPCA. (Right) Cytolytic activity measurement by co-culture of CD22-CAR;PRODH2 and CD22-CAR;PRODH2 (Stop) T cells with NALM6-GL-CD22OE cancer cells for 12h after T cells pre-treated with different concentration of 1,4-DPCA.
(H) Representative flow plots of IFNg production of CD22-CAR;PRODH2 and CD22-CAR;PRODH2(Stop) T cells after 1,4-DPCA treatment and co-culture. T cells were pre-stimulated with NALM6-GL-CD22OE cancer cells for 8 days, then treated with the 1,4-DPCA inhibitor for 3 days. The co-culture E:T = 0.5:1. (n = 4 biological replicates)
(I) Quantification of (H).
(J) GOT enzymatic inhibition experiment. Cytolytic activity measurement by co-culture of CD22-CAR;PRODH2 and CD22-CAR;PRODH2 (Stop) T cells with NALM6-GL-CD22OE cancer cells for 24h after T cells pre-treated with PF04859989.
*P<0.05, **P<0.01, ***P<0.001, ****P<0.0001, ns = not significant by multiple t tests (with adjusted P value) (G), two-way ANOVA and unpaired t tests (F, G, I, J).