
Figure 6. Characterization of long-term mitochondria energetics of PRODH2 knock-in CAR-T cells.
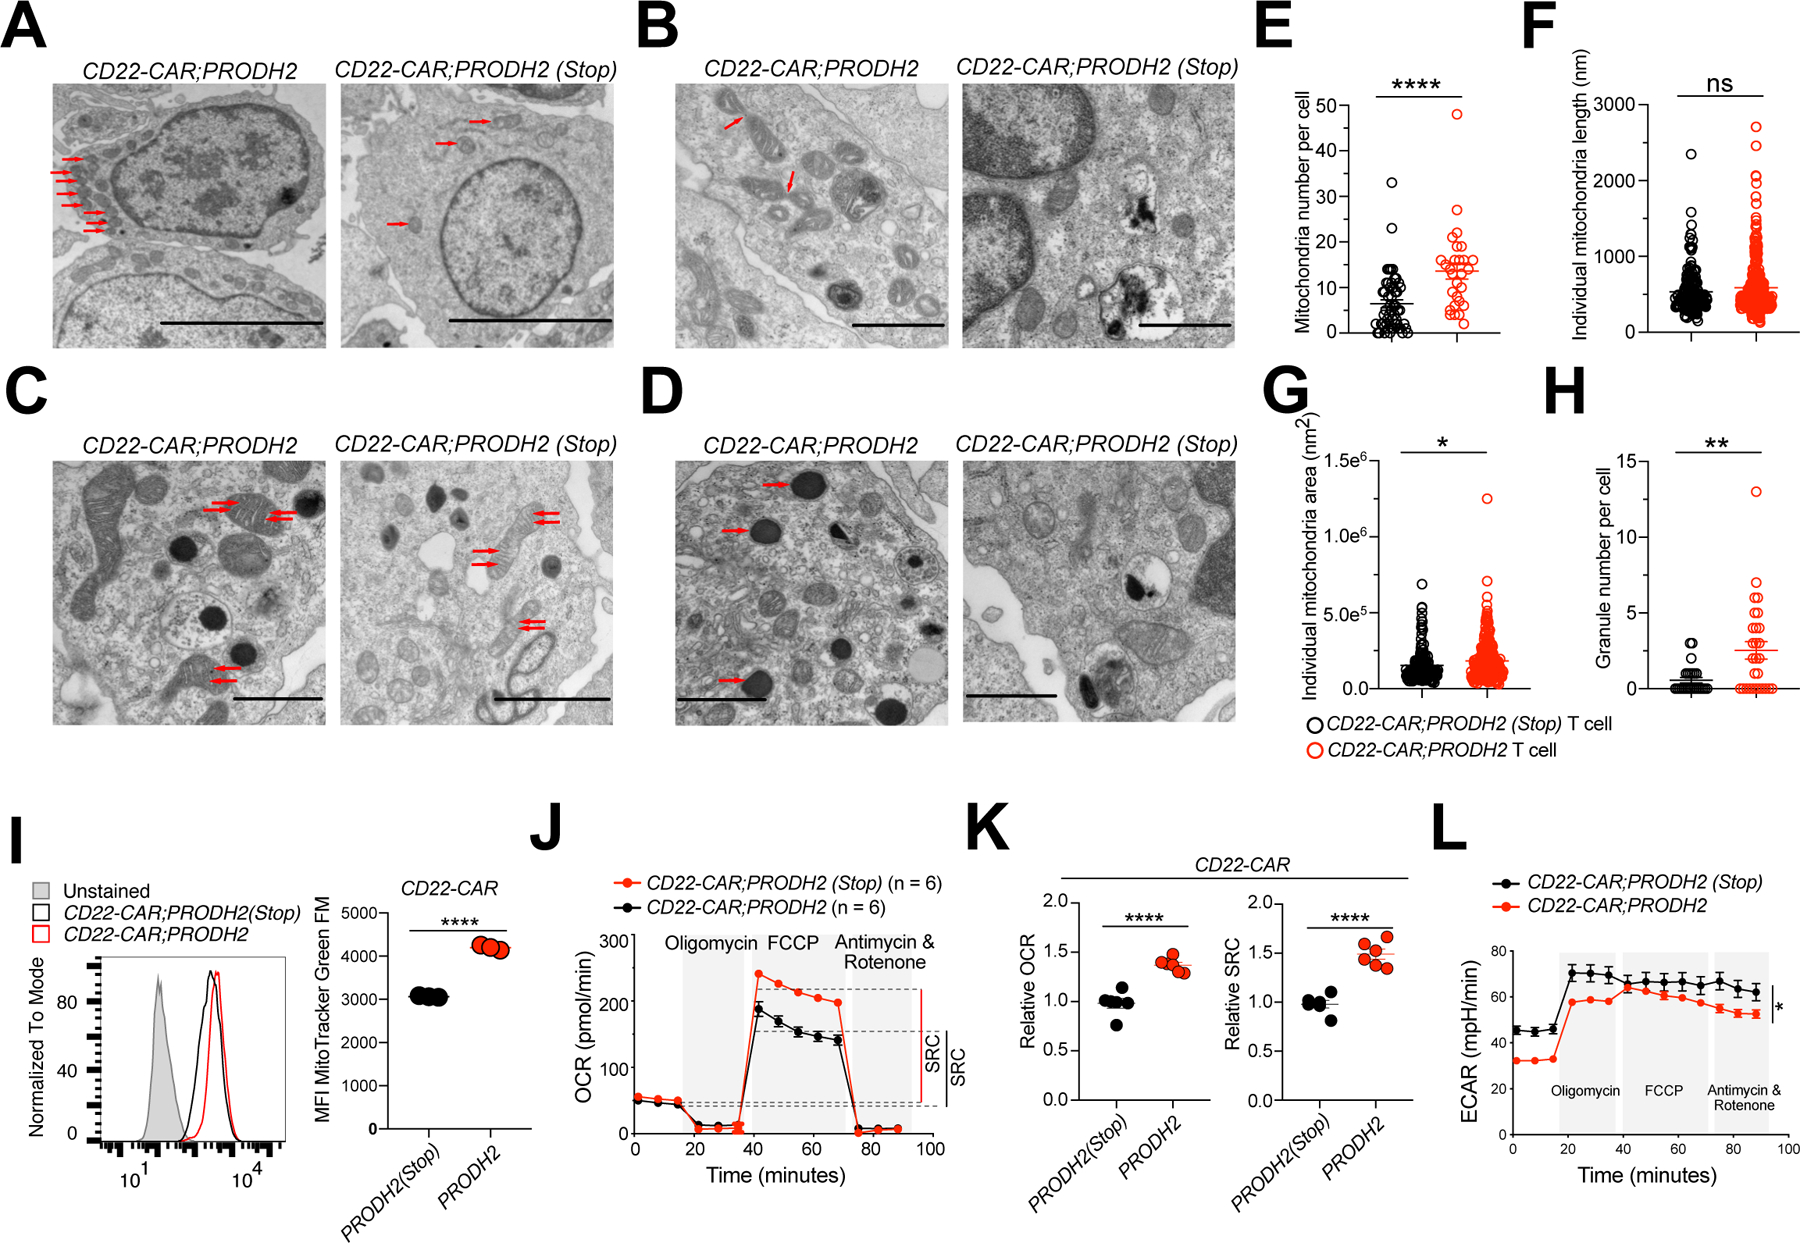
(A-D) TEM analysis of PRODH2 knock-in and Control CAR-T cells. TEM images were examined for mitochondrial numbers (A) (red arrows indicated mitochondria), mitochondrial fission (B) (red arrows indicated mitochondria fission), mitochondrial cristae remodeling (C) (red arrows indicated mitochondrial cristae), and granule numbers (D) (red arrows indicated granules). Scale bars, 5 μm (A), 1 μm (B, C (left image), D), and 2 μm (C, right image).
Data from one experiment with independent replicates.
(E) Quantification of mitochondria number per cells.
(F) Quantification of individual mitochondria length.
(G) Quantification of individual mitochondria area.
(H) Quantification of granule number per cells.
(I) Mitochondrial mass as measured by MitoTracker Green FM staining of indicated CAR-T cells at day 36 after stimulation with NALM6-GL-CD22OE cancer cells.
(J-L) Seahorse experiment of PRODH2 knock-in and Control CAR-T cells, with a density of 2e5 CAR-T cells / well (n = 6). Data are representative of three independent experiments.
(J) Oxygen consumption rate (OCR) was measured at baseline and in response to oligomycin (Oligo), FCCP, and rotenone plus antimycin A.
(K) Relative maximum OCR and relative spare respiratory capacity (SRC) were quantified.
(L) Extracellular acidification rate (ECAR) was measured at baseline and after drug treatment as the OCR measurement (n = 6). Representative data from three independent experiments.
*P<0.05, **P<0.01, ****P<0.0001, ns = not significant by unpaired t tests (E-I, K) and two-way ANOVA (L).
See also: Figure S6