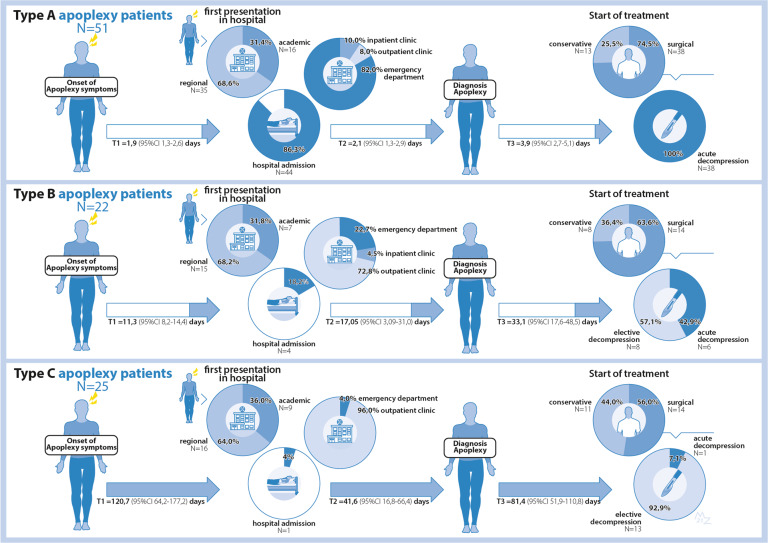
Fig. 1.
Patient journey throughout care process of apoplexy type A, B, and C patients. This figure illustrates the patient journey of apoplexy type A, B, and C patients throughout their care process until they reach treatment start. T1, time period in days between onset of apoplexy symptoms and first presentation in hospital (one way ANOVA between groups yielded p < 0.001); T2, time period in days between first presentation in hospital and moment of diagnosing pituitary apoplexy (one way ANOVA between groups yielded p < 0.001); T3, time period in days between first presentation in hospital and treatment start (one way ANOVA between groups yielded p < 0.001); Proportion of patients that were seen in a regional versus academic hospital at first presentation did not differ significantly between groups (chi-square yielded p = 0.917). Proportion of patients that were admitted to an inpatient ward in the hospital after first presentation did differ significantly between groups (chi-square yielded p < 0.001). The in hospital locations where patients were seen at their first hospital presentation significantly differed between the groups, with type A patients presenting primarily at the emergency department and almost all type C patients at the outpatient clinic (chi-square yielded p < 0.001). Proportion of patients that were treated either surgically or conservatively did not differ significantly between groups (chi-square yielded p = 0.248). Proportion of surgically treated patients that either had emergency (<3 days) or more elective (>3 days) surgery did differ significantly between groups (chi-square yielded p < 0.001)

