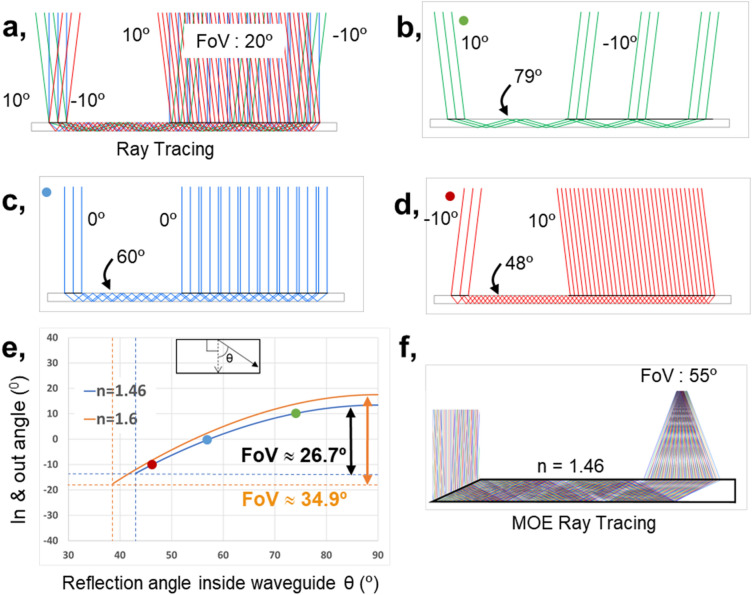
Figure 2.
Reconstructed total internal reflection and input–output propagation of the conventional optical element waveguide. The chief ray angle is illustrated. (a) Overall input–output ray propagation. (b–d) Comparisons of 10°, 0°, and − 10° propagation (e) Designed FoVs for different waveguide glass refractive indices, versus angle in waveguide. The dashed vertical lines show the total internal reflection bounds for the two corresponding refractive indices. (f) Ray tracing of MOE for 646 nm showing FoV of 55°.

