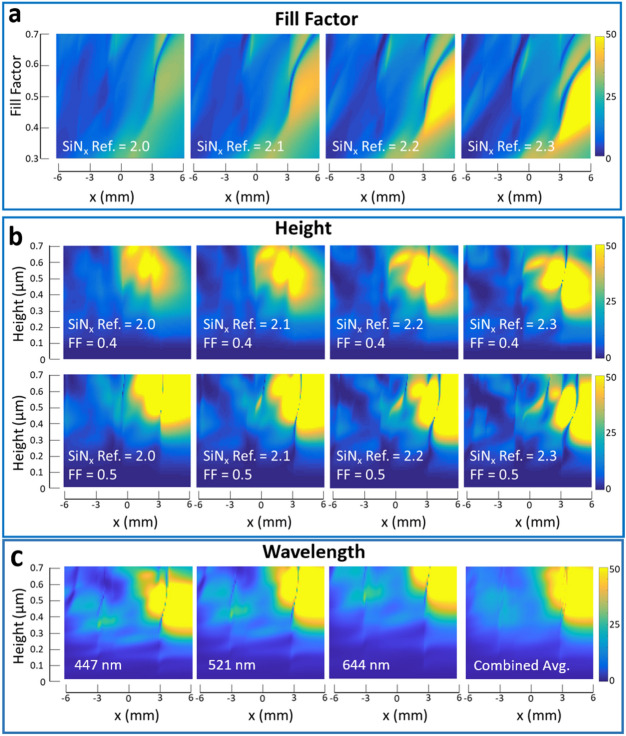
Figure 3.
Numerical design map optimization of the metasurface waveguide glass, showing the metasurface optical waveguide display diffraction efficiencies for input/output MOE in the waveguide propagation direction for different positions in the waveguide x, fill factor (FF), and height parameters. Rigorous coupled-wave analysis (RCWA) numerical simulation is used in each design point of the 2D maps. (a) The height is fixed at 0.35 nm. Color scale bar denotes total intensity input–output propagation efficiencies in percentage. (b) Top panel for a fill factor (FF) of 0.4 and bottom panel for a fill factor of 0.5, with varying waveguide heights. The same color scale bar is used. In this implementation, optimal regions for the waveguide heights, fill factors and refractive indices of the metasurface are denoted. (c) Fill factor 0.46 and SiNx refractive index of 2.14 (at wavelength 521 nm) with wavelengths of 447 nm, 521 nm, and 644 nm for blue, green, and red, respectively and the combined average.

