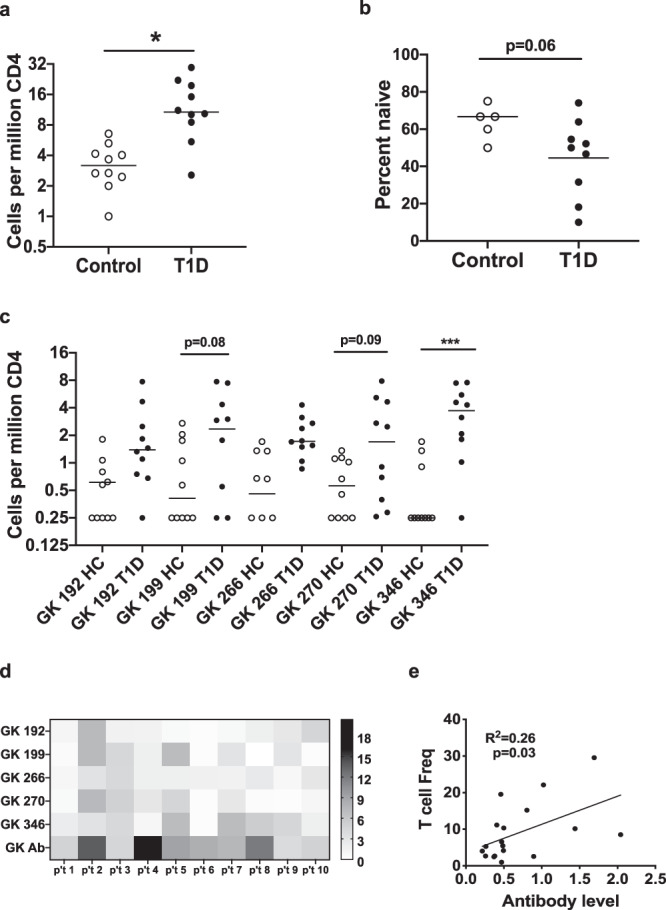
Fig. 3. GK specific CD4+ T cells are more frequent in subjects with T1D and are correlated with anti-GK antibodies.

a Comparison of total GK reactive CD4+ T cell frequencies in the peripheral blood of 10 healthy controls and 10 subjects with T1D. The total frequencies of glucokinase-reactive T cells (GK 192, 199, 266, 270, and 346 combined) were significantly higher (*; p = 0.0007, Mann Whitney test) in subjects with T1D (black circles) than in HLA matched controls (white circles). b GK specific CD4+ T cells tended to be more naïve (CD45RA+ CR7+) in healthy controls than in subjects with T1D (p = 0.064, Mann Whitney test). c Individual frequencies were significantly higher in subjects with T1D (black circles) than in healthy controls (white circles) for GK 346 (***; p = 0.0004, ANOVA followed by Sidak’s multiple comparisons test). Individual frequencies trended toward being higher for GK 199 and GK 270 (p = 0.08 and p = 0.09 respectively) but did not reach statistical significance. d A heatmap analysis of individual GK T cell frequencies in subjects with T1D, indicating patterns of reactivity that differed between subjects. In the heatmap each column represents one subject and each row reflects one GK specificity, with each square color coded to indicate the observed T cell frequency in cells per million. The antibody readout is indicated at the bottom individually. e There was a significant positive correlation between the combined frequency of GK-reactive T cells and levels of anti-glucokinase antibodies (p = 0.030, simple linear regression).
