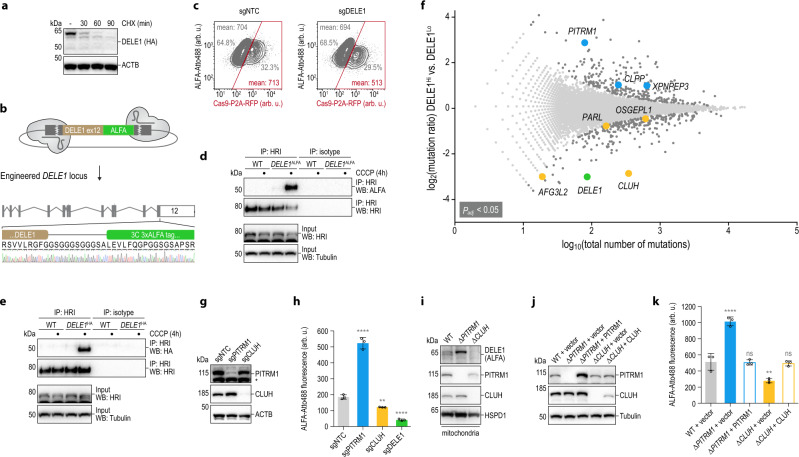
Fig. 1. Genome-wide screen for regulators of DELE1.
a HeLa cells expressing endogenous DELE1HA were treated with cycloheximide (CHX) and analyzed by immunoblotting. ACTB, β-actin. b The endogenous DELE1 locus in HAP1 cells was engineered with a C-terminal triple ALFA tag using CRISPR-Cas9. In-frame fusion verified by Sanger sequencing. c HAP1 DELE1ALFA cells were lentivirally transduced to express a single guide non-targeting control (sgNTC) or an sgRNA targeting DELE1 (sgDELE1) together with Cas9-P2A-RFP at a multiplicity of infection < 1, such that each population comprises sgRNA-containing cells (RPF+) and non-transduced wild-type cells. DELE1ALFA was stained with Atto488, values specify mean Atto488 intensity in transduced (RFP+; red box) and non-transduced (RFP-) cells. d, e HAP1 cells of the indicated genotypes were treated with CCCP and the ability of endogenous HRI to co-precipitate the respective S-DELE1 proteins was analyzed by immunoblotting. WT, wild-type. f Haploid genetic screen for regulators of DELE1. Per gene (dots), the ratio of the frequency of mutations in DELE1ALFA-high versus DELE1ALFA-low cells (y-axis) is plotted against the combined number of unique mutations identified in both populations (x-axis). Genes significantly enriched for mutations in either population are dark gray or colored (two-sided Fisher’s exact test, FDR-corrected P-value (Padj) < 0.05). g HAP1 DELE1ALFA cells were exposed to sgRNAs as indicated. Knockout efficiency was analyzed by immunoblotting. Asterisk: nonspecific band. h DELE1 protein levels (cells as in (g)) analyzed by flow cytometry. Mean ± s.d. of n = 3 independent biological samples (arb. u., arbitrary units). Statistical significance compared to sgNTC assessed using ordinary one-way ANOVA with Dunnett’s multiple comparisons correction. ****P < 0.0001, **P = 0.0094. i Mitochondrial DELE1 protein levels of clonal HAP1 DELE1ALFA PITRM1 or CLUH knockout cells analyzed by immunoblotting. j Clonal HAP1 DELE1ALFA PITRM1 and CLUH knockout cells reconstituted with the respective cDNAs or vector control analyzed by immunoblotting. k DELE1 protein levels (cells as in (j)) analyzed by flow cytometry. Mean ± s.d. of n = 3 independent biological samples. Statistical significance compared to WT + vector assessed with ordinary one-way ANOVA and Dunnett’s multiple comparisons correction; ns, non-significant. ****P < 0.0001, **P = 0.0020, ns ≥ 0.9783.

