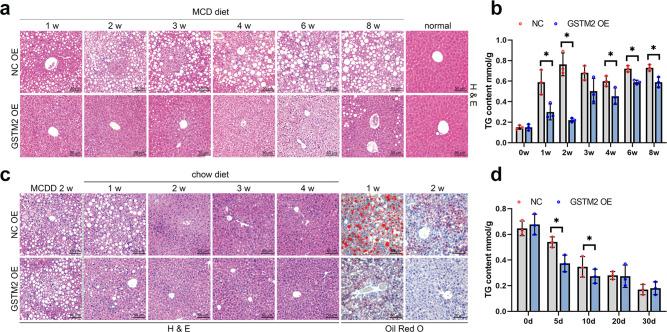
Fig. 2. GSTM2 overexpression protected against hepatic fat storage.
a HE staining analysis of liver samples of GSTM2 overexpression (OE) and control mice challenged with MCDD at 1 w, 2 w, 3 w, 4 w, 6 w, and 8 w. b Hepatic TG concentrations of GSTM2 OE and control mice with MCD diet treatment at 0 w, 1 w, 2 w, 3 w, 4 w, 6 w, and 8 w; *p < 0.05. c Oil red O staining analysis of liver samples of GSTM2 OE and control mice fed MCDD for 2 w and then chow diet. d Hepatic TG concentrations of corresponding mice in (c); *p < 0.05. bar, 50 μm.

