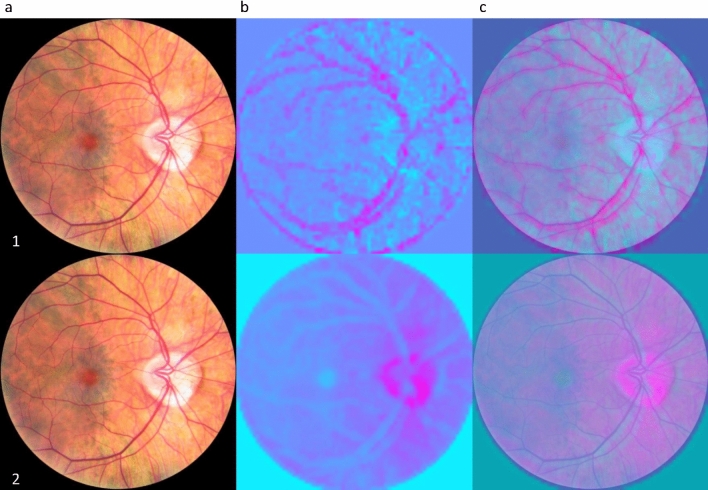
Figure 3.
Saliency maps highlighting where the network focus when predicting age (1) and global cognition (2). Column (a) is the input image, (b) is the saliency map and (c) is the overlap of (a) and (b). The pink regions on the saliency maps are the one having influence in making the prediction while blue regions had lower importance. Highlighted regions were noted from 100 randomly selected images. For global cognition, the ONH was highlighted in 94% of sampled images, the background was highlighted in 44% of images, the vessels were highlighted in none of the images (0%) and non-specific regions (non-specific feature, edge of retinal scans, etc.) were highlighted in 24% of images. Regarding age, the ONH was highlighted in 1% of images, the background was highlighted in 2% of images, the vessels were highlighted in 89% of the images and non-specific regions were highlighted in 9% of images.

