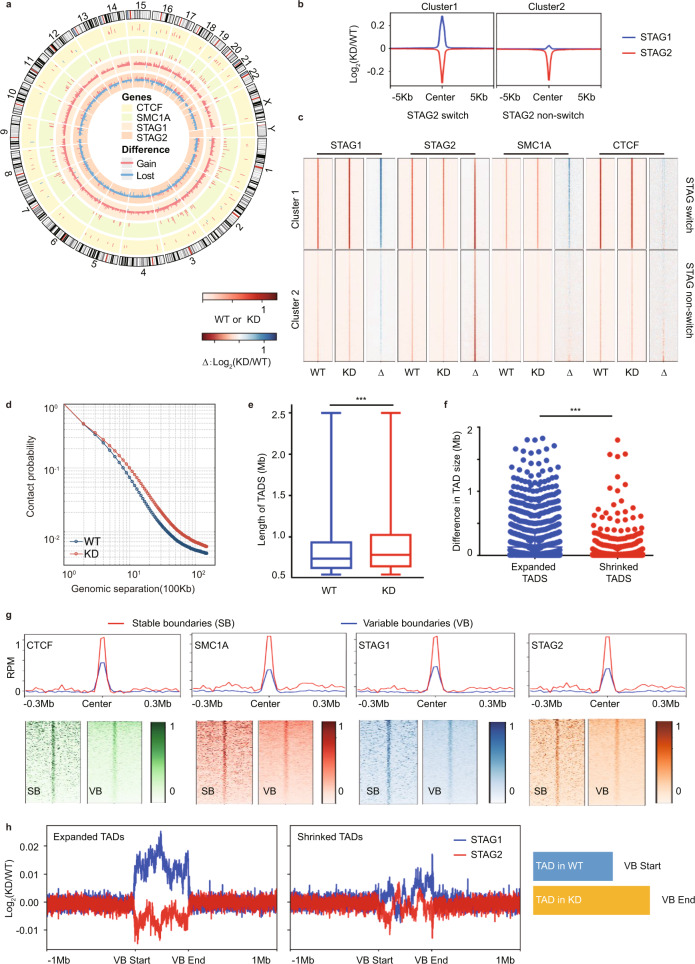
Fig. 1. Loss of STAG2 affects 3D genome structure.
a Circos plot for differential peaks of CTCF, SMC1A, STAG1, and STAG2 binding upon STAG2 knockdown in M14 cells. Red bar represents gain of binding and blue bar represents loss of binding. b Distinct profiles of changes in STAG1 binding at the loss of STAG2 binding sites upon STAG2 knockdown in M14 cells. The STAG switch and non-switch groups are identified by k-means clustering and show significant gain or nearly no gain in STAG1 binding at the loss of STAG2 binding sites, respectively. c Heatmap of normalized ChIP-seq signals for STAG1, STAG2, SMC1A, and CTCF in M14 cells with (KD) and without (WT) STAG2 shRNA knockdown and their changes (Δ), as defined by log2(KD/WT), in both STAG switch (cluster 1) and non-switch groups (cluster 2). d Average contact probability at a different genomic distance for KD and WT, using 100 kb as window size. e Average TAD length is significantly different between STAG2 WT (n = 3789 TADs) and KD (n = 3496 TADs). The box plot is defined by bounds at the 25th percentile and 75th percentile, center at 50th percentile, the minima and maxima are at the 10th percentile and 90th percentile. P value is 3.488e-13 and is based on a two-sided Wilcox test. f Difference in TAD size for expanded TADs (n = 1125 TADs) is significantly longer than those of shrinked TADs (n = 1007 TADs). P value is 2.312e-17 and is based on a two-sided Wilcox test. g CTCF, SMC1A, STAG1, and STAG2 profiles at stable and variable TAD boundaries in M14 STAG2 WT cells. RPM reads per million. h Remarkable STAG2 to STAG1 switch occurs at boundaries of expanded TADs but not shrinked TAD upon STAG2 knockdown. The schematic diagram depicts that the variable boundary (VB) start site is defined as the site in WT, and the related end site as the site in KD. Statistical significance is determined as: ns P > 0.05; *P < 0.05; **P< 0.01; ***P < 0.001.

