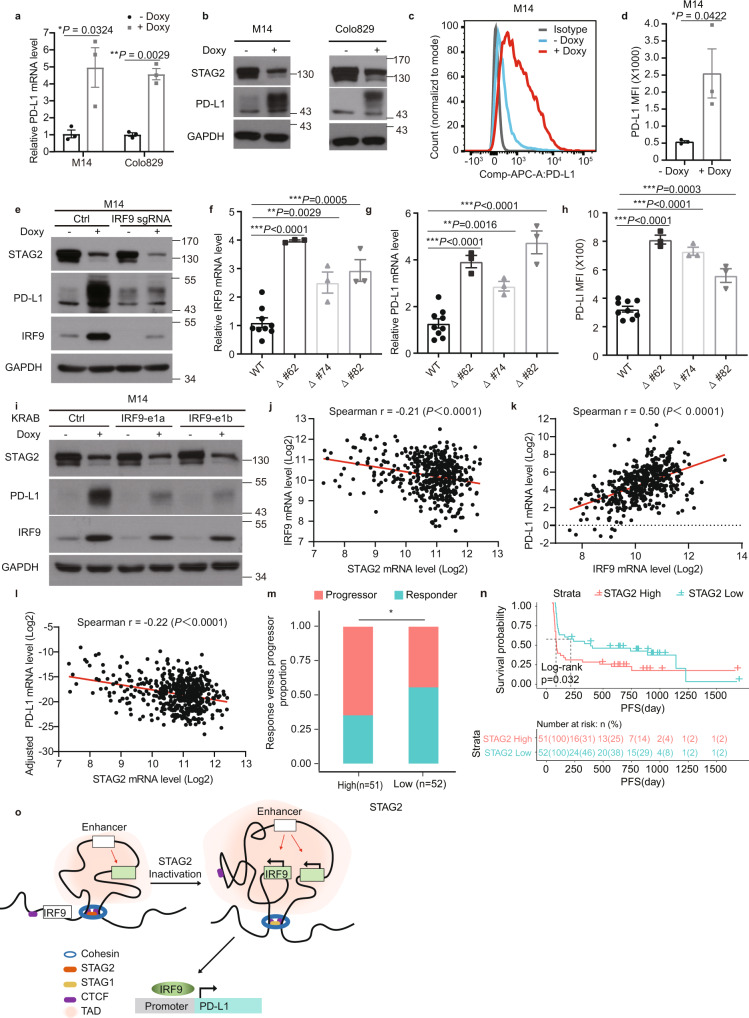
Fig. 4. STAG2 regulates the expression of IRF9 and PD-L1 in melanoma via modulating 3D genome organization at the IRF9 locus.
a–d Effects of doxy-inducible STAG2 shRNA knockdown on mRNA (a), protein (b), and surface expression (c, d) levels of PD-L1 in human melanoma cells (n = 3). e STAG2 regulates PD-L1 expression via IRF9 in human M14 cells. f–h Effects of CRISPR/Cas9-mediated deletion of the STAG2 binding site at the boundary of the TAD downstream of IRF9 on the expression of IRF9 (f) and PD-L1 (g, h) in human M14 cells (n = 3). Three independent clones of binding site deletion or control were used in the analyses. i IRF9 enhancer inactivation reversed the regulation of PD-L1 by STAG2 KD in M14 cells. j–l Correlation between STAG2 and IRF9 mRNA levels (j), IRF9 and PD-L1 mRNA levels (k), STAG2 and PD-L1 mRNA levels adjusted for STAT1 (l) in TCGA SKCM patients (n = 473). All expression values were log2 transformed. The Spearman’s correlation coefficient R value and the two-sided P value are shown. m Proportion of responders versus progressors in the overall cohort with high and low STAG2 mRNA expression level (divided by the median). (two-sided Fisher’s exact test, P = 0.04827). n Progression-free survival (PFS) stratified by high versus low STAG2 mRNA expression level (split by the median) in our overall cohort. Tumors with high STAG2 had worse PFS (two-sided KM log-rank test, P = 0.032). o A schematic model depicts the regulation of IRF9 and PD-L1 expression by STAG2 via modulating 3D genome organization at the IRF9 locus. Data in b, c, e, i are representative of three independent experiments with similar results. Data in a, d, f–h are presented as mean ± SEM. P values in a, d were determined by two-tailed ratio paired t-tests. P values in f–h were determined by unpaired two-tailed t-tests compared with the WT cells. Statistical significance is determined as: ns P > 0.05; *P < 0.05; **P < 0.01; ***P < 0.001.

