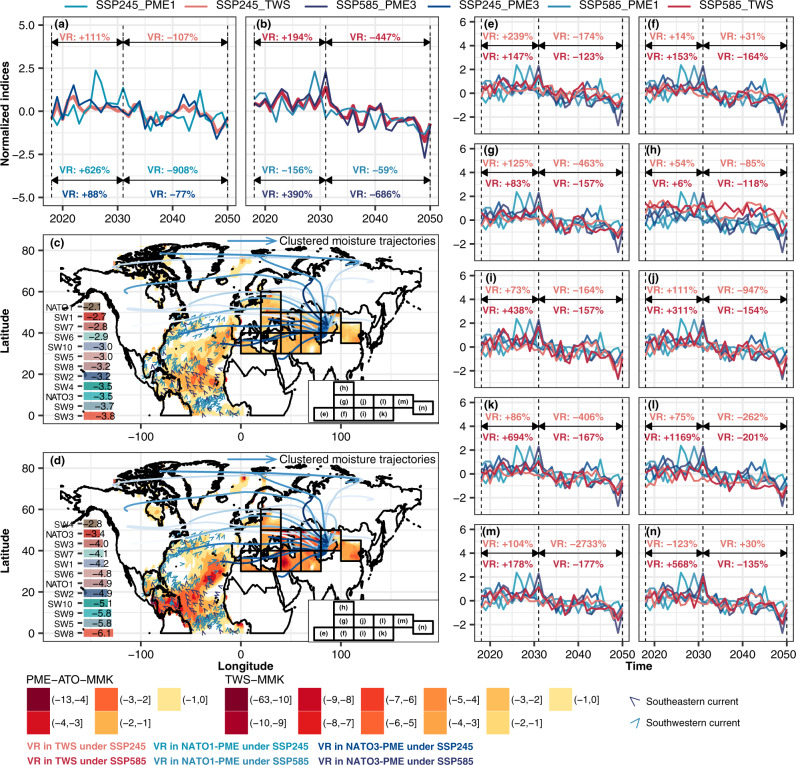
Fig. 4. Projected spatiotemporal evolutions in PME over NATO and TWS in HSR1-10.
Temporal variations in the annual-sum normalized trend items of the zonal sums of TWSs across the whole HSR1-10 and variations in the annual-sum normalized trend items of zonal sums of PMEs in NATO1 and NATO3 under SSP245 and SSP585 during 2018–2050 (a, b). Spatial patterns of the modified Mann-Kendall (MMKs) trends of PME over NATO and TWS in HSR1-10 under SSP245 (c) and SSP585 (d) during 2018–2050 (c, d). Temporal variations in the annual-sum normalized trend item of the zonal sum of TWS over every HSR and annual-sum normalized trend items of the zonal sums of PMEs in NATO1 and NATO3 under SSP245 and SSP585 during 2018–2050, respectively (e–n). The VR in the plot refers to the varying rates of indices during the time interval, i.e., 2018–2031 and 2031–2050. The moisture trajectories in subplot (c, d) were categorized using the k-means cluster method based on the locations of water particles.

