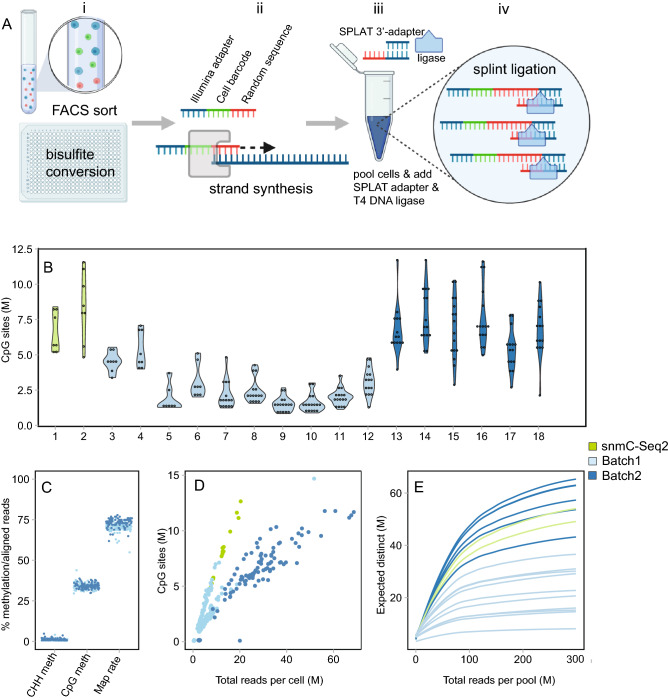
Figure 1.
Schematic overview of the scSPLAT method and quality assessment of single cell K562 data. (A) Step i-iv. i) Cells are FACS sorted into 384 wells containing lysis buffer and bisulfite conversion is performed in 384-plate format. ii) A random strand synthesis reaction is performed in each well using a randomer flagged with an inline cell barcode and 26 bp of the Illumina P5 adapter sequence. iii) Reactions from multiple wells (up to 32) are then pooled and SPRI bead purified. iv) Splinted ligation adapter tagging (SPLAT) is performed to ligate the adapter to the 3’-ends of the DNA fragments in a bulk reaction. (B) Violin plots showing the total number of covered CpG sites/cell in each library pool. Individual cells are indicated by dots overlaying the plots. Violin plot number 1–6 comprises 8 cells and number 7–18 comprises 16 cells. (C) The percentage of CHH methylation (indicative of bisulfite conversion efficiency), methylation levels in CpG-context and read mapping efficiency per K562 cell. (D) The number of CpG sites per cell covered ≥ 1 × plotted as a function of the total number of (raw) reads generated per cell. (E) Pool-wise library complexities plotted with the c-curve function in the preseq tool.

