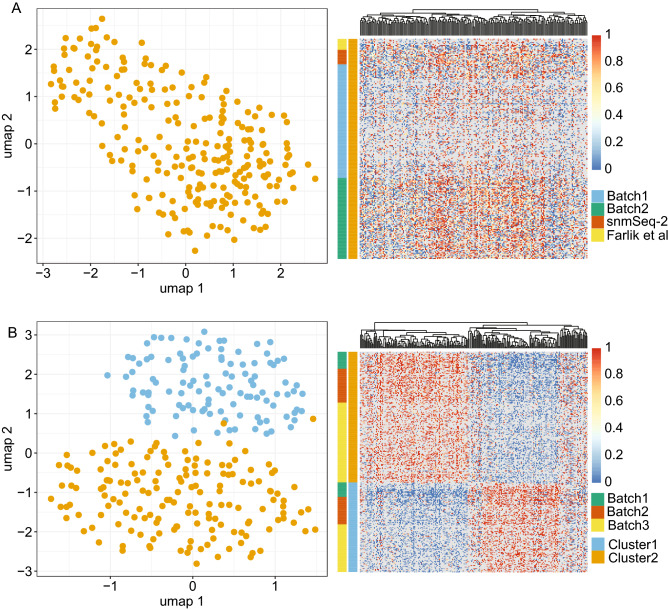
Figure 3.
Clustering of K562 and Liver nuclei based on single cell DNA methylation profiles. (A) K562 cells. Left panel show UMAP visualization of Epiclomal Region clustering of K562 cells based on CpG-island methylation. Right panel is a heat map showing mean methylation of the regions (CpG-islands) used as input for Epiclomal Region clustering of K562 cells. Blue color indicates no methylation and red color high methylation, Greys boxes in the heatmap indicates missing values. (B) Liver nuclei. Left panel show UMAP visualization of Epiclomal Region clustering of liver nuclei based on CpG-island methylation. Right panel is a heat map showing mean methylation of the regions (CpG-islands) used as input for Epiclomal Region clustering of liver nuclei.

