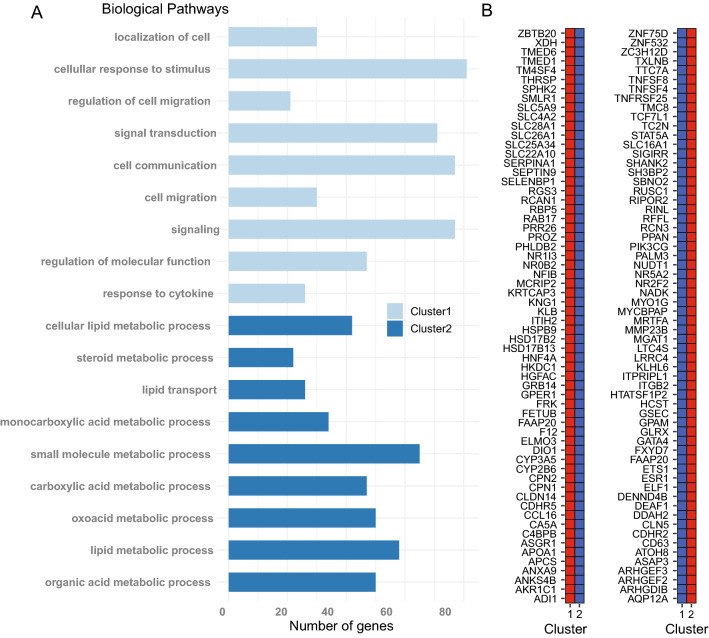
Figure 4.
Cluster specific gene ontology pathway analysis. (A) Result from gene ontology pathway analysis. Genes associated with a hypomethylated DMR in cluster 1 or cluster 2 and located in a promoter and/or TSS region, were used as input for GO pathway analysis. The most significant biological pathways found for cluster 1 and cluster 2, respectively are shown. Metabolic pathways were identified in cluster 2, indicating hepatocytes (HCs). For cluster 1 the identified GO pathways did not reveal a specific cell type (B) A subset of the genes with DMRs in promoter regions. The DNA methylation status of the DMRs in each respective cluster are shown (low methylation = blue, high methylation = red).

