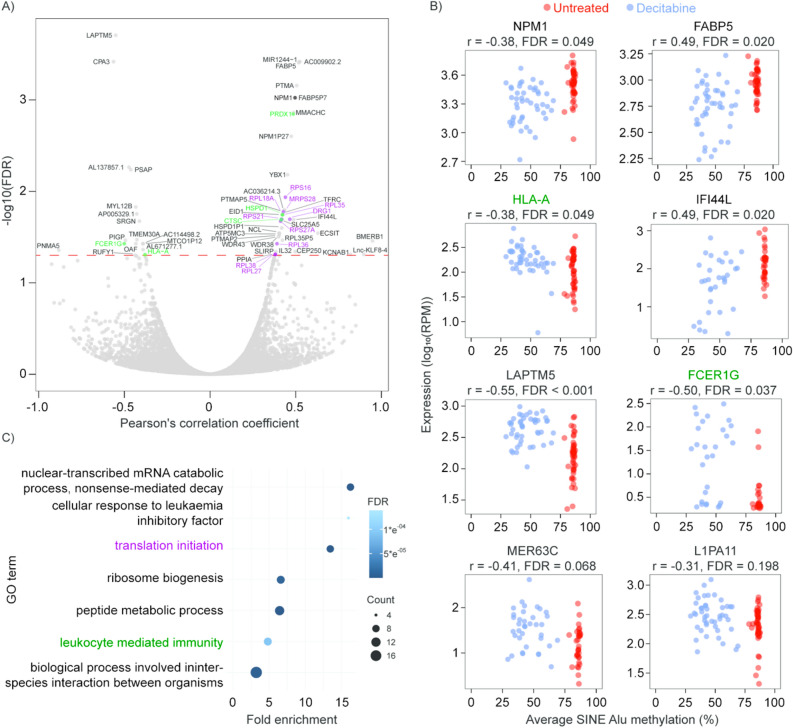
Figure 2.
Correlations between average DNA methylation levels and gene expression. (A) Volcano plot showing Pearson’s correlation between average DNA methylation in SINE Alu elements and gene expression in the KG1a dataset. Genes involved in ‘translational initiation’ and ‘leukocyte mediated immunity’ are highlighted in purple and green, respectively. (B) Select examples showing expression levels of an individual gene and average DNA methylation levels in our treated and untreated KG1a cells. Examples include 6 genes (NPM1, FABP5, HLA-A, IFI44L, LAPTM5 and FCER1G) and 2 TEs (MER63C and L1PA11). The Pearson’s correlation coefficient (r) and false discovery rate (FDR) for each correlation are shown. RPM = reads per million. (C) Gene ontology (Panther) results for statistically overrepresented biological pathways in all genes with expression correlated to DNA methylation (FDR < 0.05). For related terms, only the pathway with the highest number of correlated genes is displayed for simplicity.

