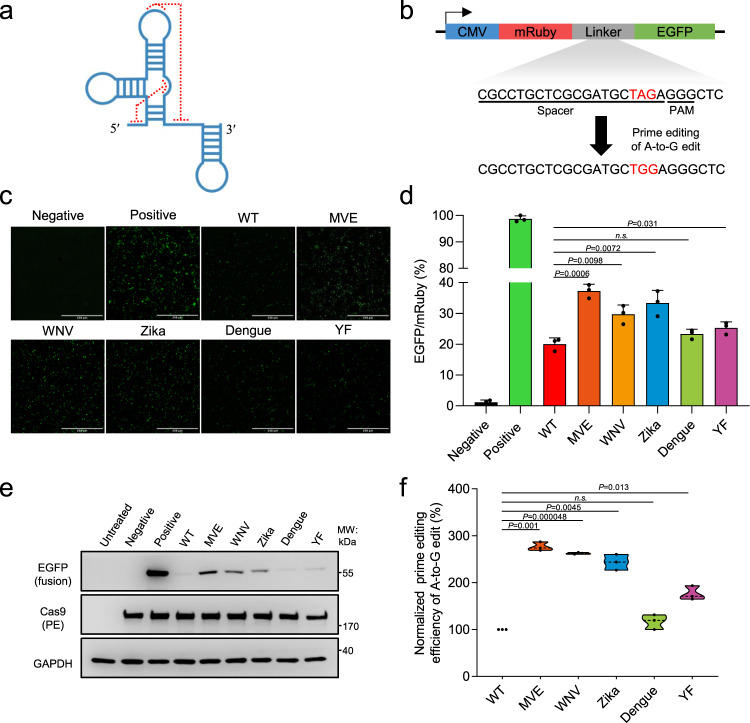
Fig. 1. The xrRNA-joined pegRNAs show enhanced prime editing activities toward a reporter.
a The schematic secondary structure of a representative xrRNA motif. Some long-distance interactions (highlighted by red dotted lines) contribute to the formation of a stable knot-like structure. b Illustration for the fluorescent prime editing reporter system. The translation of EGFP sequence as part of a mRuby-led fusion protein is prevented by a stop codon (TAG, red). Prime editing-mediated of A-to-G edit would allow the expression of mRuby-EGFP fusion protein. The spacer sequence and the PAM for prime editing are underlined. c. The xrRNA motifs from five different viruses: Murray Valley encephalitis (MVE), West Nile virus (WNV), Zika, Dengue (Dengue), and Yellow Fever (YF)) were appended to the 3′ end of pegRNAs that targets the reporter. In results shown in c–f, HEK293T cells were co-transfected with plasmids for PE2, WT or modified pegRNA, and the reporter. EGFP+ cells were observed under a fluorescent microscope. Transfection of PE2, a non-targeting pegRNA and the reporter served as the negative control, whereas in the positive control the reporter plasmid was replaced with one encoding a constantly expressing mRuby-EGFP fusion protein. Scale bars, 250 µm. d Following prime editing using WT pegRNA and xr-pegRNAs, the frequencies (%) of EGFP+ (relative to mRuby+) were measured by flow cytometry. e Following prime editing using WT pegRNA and xr-pegRNAs, the expression of EGFP was determined by Western blot. f The reporter-targeted editing efficiencies were determined by deep-sequencing of DNA prepared from mRuby+ cells. The editing frequencies induced by PE with WT pegRNA were set as 100%. In quantitation shown in d and f, data are presented as mean values ±SD, n = 3 biological replicates. Two-tailed Student’s t tests (one-sample test for f) were performed (P values are marked on the graphs, n.s. not significant). The P values [n.s.] not marked on d and f are 0.09 and 0.20, respectively. Source data are provided as a Source Data file.

