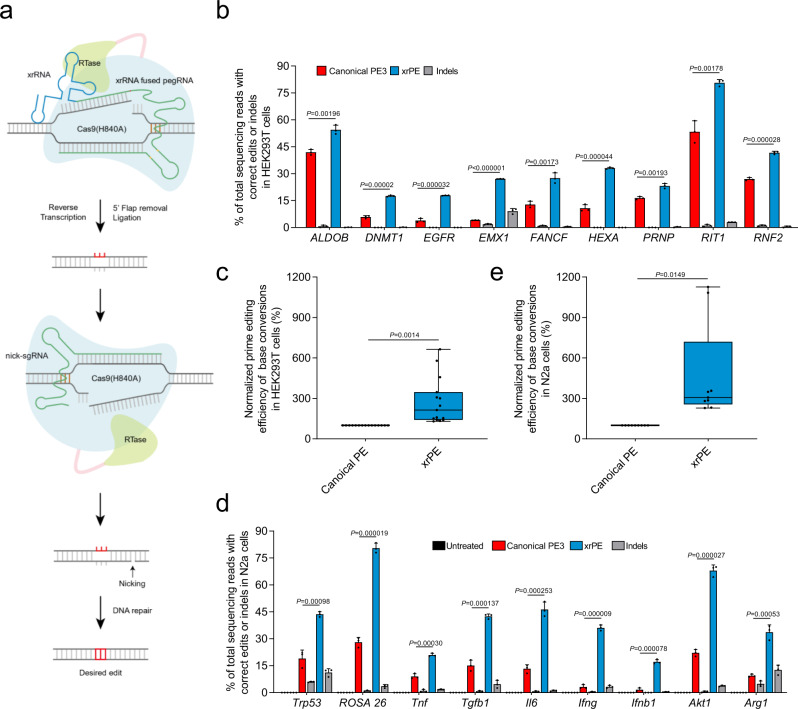
Fig. 3. The xrPE shows enhanced performance for base conversions in multiple cell types.
a An illustration for the xrPE platform. The joining of an xrRNA motif (Zika) to the 3′ end of pegRNA is shown. A fusion protein of Cas9 H840A nickase and a reverse transcriptase (Moloney Murine Leukemia Virus, M-MLV) is guided by the modified pegRNA to a DNA target. The yellow marks within xrRNA-joined pegRNA indicate an alternative C-G base pair replacing a U-A in the main scaffold, to potentially reduce premature termination8. The prime editor nicks the DNA and reverse transcribes using the 3′-extended portion of pegRNA as the template. This is followed by 5′ flap removal and ligation to complete editing on one strand. When supplying another sgRNA to nick the non-edited strand, the cellular DNA repair mechanisms tend to install the desired edit into the genome. b HEK293T cells were transfected with plasmids for canonical PE3 or xrPE for base conversion at 9 individual sites as indicated. Correct editing efficiencies were determined by deep-sequencing (mean ± SD, n = 3 biological replicates). For targets same as those in Fig. 2c, a consistent pattern of activity enhancements is noted. Gray bars next to those for PE3 (red) and xrPE (blue) indicate the indel frequencies associated with each tool. c Results in b and Supplementary Fig. 8a are further analyzed by considering editing at all sites (n = 15 sites) as a whole. The editing frequencies induced by canonical PE3 were set as 100%. d. The experiment similar to b was carried out in N2a cells (base conversions at 9 individual sites). The rates for correct editing and indel formation are shown (mean ± SD, n = 3 biological replicates). e Results in d were further analyzed by considering editing at all sites (n = 9 sites) as a whole. The editing frequencies induced by canonical PE3 were set as 100%. Multiple t tests (two-tailed) were performed in data from b, d. Discoveries were determined using the two-stage linear step-up procedure of Benjamini, Krieger, and Yekutieli, with Q = 1%. When discoveries are made (9/9 in b and 9/9 in d), the exact P values (unadjusted) are shown on the graphs. In the box plots shown in c, e, each data point represents the averaged editing activity at the particular site. The center line shows medians of all data points and the box limits correspond to the upper the lower quartiles, while the whiskers extend to the largest and smallest values. Two-tailed one-sample Student’s t tests were performed (with P values marked). Source data are provided as a Source Data file.

