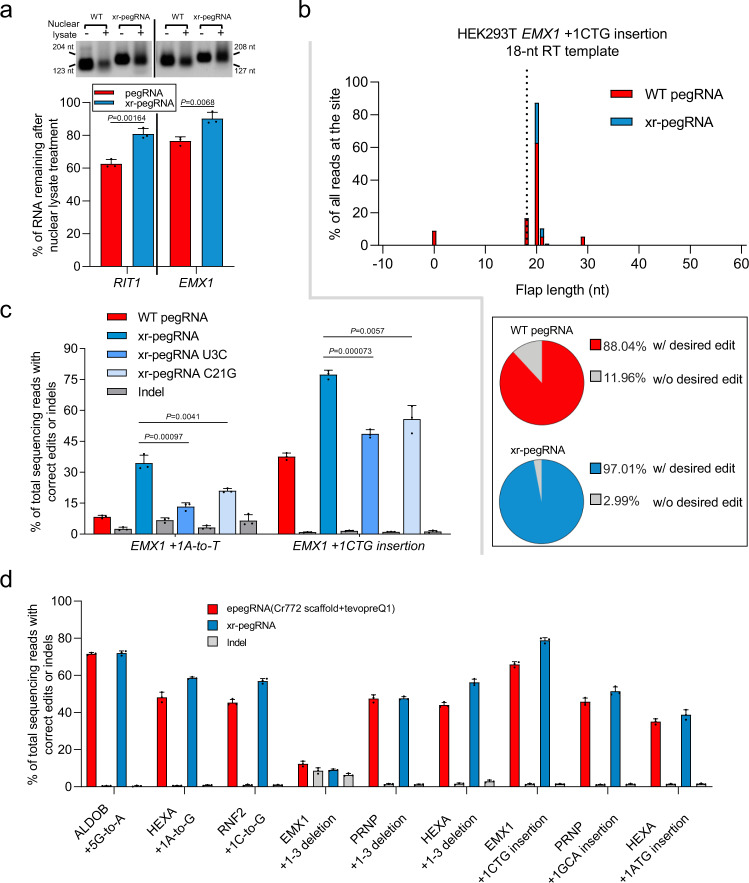
Fig. 5. The 3′ xrRNA stabilizes xr-pegRNA to enhance prime editing, resulting in comparable performance as the latest epegRNA-based strategy.
a The stability of in vitro-transcribed WT pegRNAs or the corresponding xr-pegRNAs upon exposure to HEK293T nuclear lysates. A representative agarose gel with samples from biological triplicates is shown. The sizes of the products (nt) are marked on the side. The levels for untreated WT pegRNAs or xr-pegRNAs were considered as 100%. Data presented are from quantitation of band intensity from 3 biological replicates (mean ± SD). The amounts of remaining pegRNAs or xr-pegRNAs were compared (two-tailed Student’s t tests, with P values marked). b Comparison of PE intermediates generated by PE2 with either WT pegRNAs or xr-pegRNAs at EMX1 site in HEK293T cells. The black dotted line represents the end of the full-length RT template (18 nt). In the histogram, the x axis corresponds to the sizes of the 3′ flaps, with the first base downstream of the PE2-induced nick denoted as position +1, while the y axis represents the relative abundance of the reads (percentage of all reads). The bottom box contains pie charts showing percentages of reads with (red/blue) or without (gray) intended edits. The data presented are calculated from an average of three independent biological replicates. c The WT pegRNA, xr-pegRNA, and two mutant xr-pegRNAs bearing either U3C or C21G mutations at the xrRNA domain were used in a PE3 context for base conversion or insertion at the EMX1 sites in HEK293T cells. The editing efficiencies were determined (mean ± SD, n = 3 biological replicates) and compared (two-tailed Student’s t tests, with P values marked). d The efficiencies by PE with xr-pegRNA (xrPE), or epegRNA (containing tevopreQ1 motif and Cr772 scaffold) for nine different genetic modifications attempted in our earlier experiments. Gray bars next to the red/blue-colored bars indicates the indel frequencies in association with a particular experiment group, where the editing efficiency is shown in red or blue (mean ± SD, n = 3 biological replicates). Source data are provided as a Source Data file.

