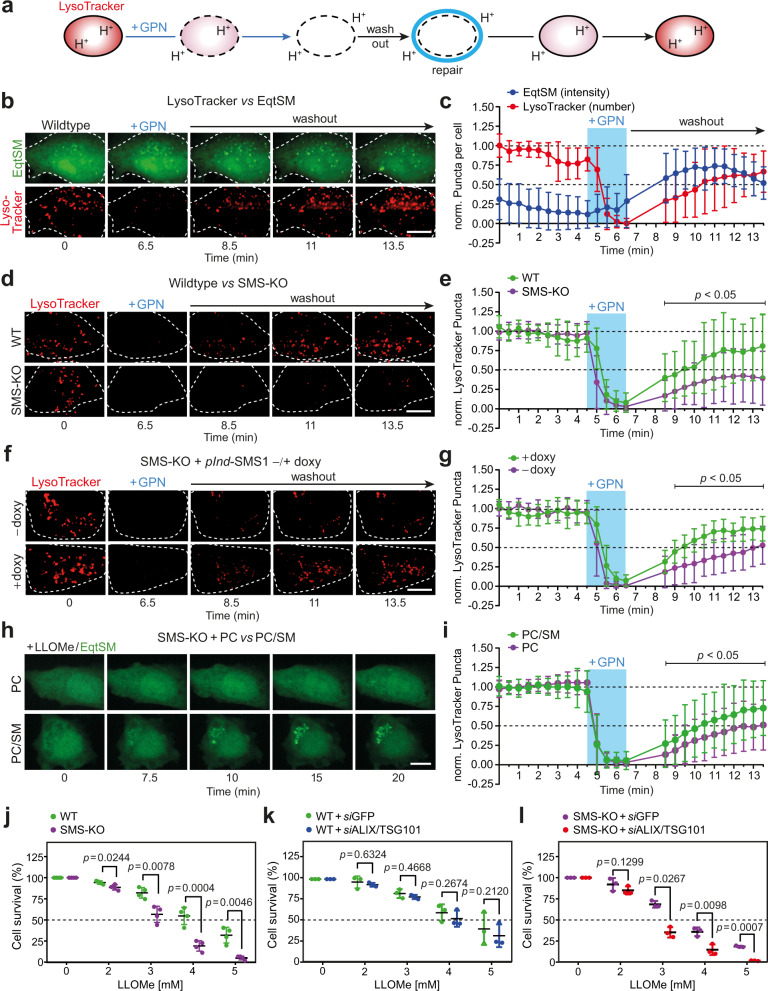
Fig. 3. SM is critical for the recovery of lysosomes from acute damage.
a Schematic outline of lysosomal repair assay. b Time-lapse images of LysoTracker-labeled/EqtSM-expressing HeLa cells pulse-treated with GPN (200 μM, 2 min). c Time-course plotting LysoTracker- and EqtSM-positive puncta in cells treated as in (b). Data are means ± SD. n = 18 cells over four independent experiments. d Time-lapse images of LysoTracker-labeled WT and SMS-KO HeLa cells pulse-treated with GPN. e Time-course plotting LysoTracker-positive puncta in cells treated as in (b). Data are means ± SD. n = 29 cells for WT, 24 cells for SMS-KO over four independent experiments. f Time-lapse images of LysoTracker-labeled SMS-KO cells transduced with doxycycline-inducible SMS1 (pInd-SMS1) and pulse-treated with GPN following 48 h preincubation without (–doxy) or with 1 µg/ml doxycycline (+doxy). g Time-course plotting LysoTracker-positive puncta in cells treated as in (d). Data are means ± SD. n = 20 cells for +doxy, 17 cells for –doxy over three independent experiments. h Time-lapse images of SMS-KO cells expressing EqtSM treated with 1 mM LLOMe for the indicated time following 16 h preincubation with 160 μM PC or PC/SM (70/30 mol%). i Time-course plotting LysoTracker-positive puncta in SMS-KO cells pulse-treated with GPN following preincubation with PC or PC/SM as in (h). Data are means ± SD. n = 50 cells per condition over three independent experiments. j Survival rate of WT and SMS-KO cells after 5 h exposure to LLOMe at the indicated concentration. Data are means ± SD. n = 4 independent experiments. k Survival rate of WT cells pre-treated with siRNAs targeting GFP or ALIX/TSG101 for 72 h and exposed for 5 h to LLOMe at indicated concentrations. Data are means ± SD. n = 3 independent experiments. l Survival rate of SMS-KO cells pre-treated with siRNAs targeting GFP or ALIX/TSG101 for 72 h and exposed for 5 h to LLOMe at indicated concentrations. Data are means ± SD. n = 3 independent experiments. P values were calculated by unpaired (e, g, i) or paired two-tailed t test (j, k, l). Scale bar, 10 µm.

