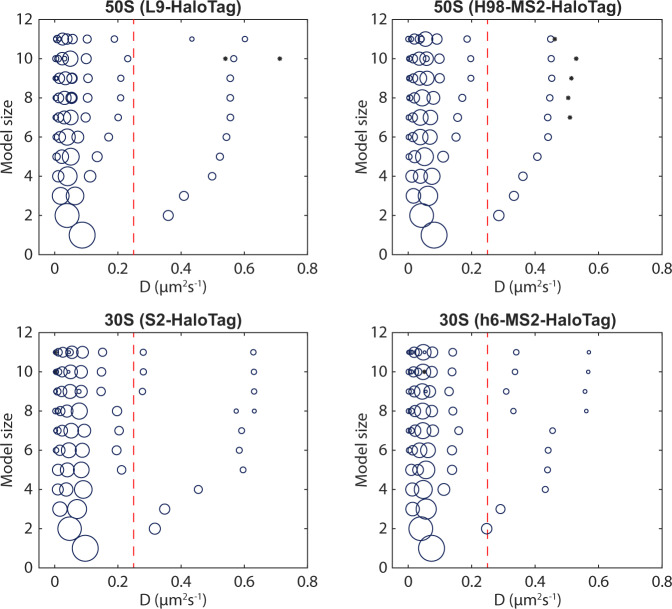
Fig. 2. HMM-estimated occupancies in different diffusion states for all fitted model sizes.
The area of the circles is proportional to the relative occupancy. Occupancies lower than 1% are shown as *. The red dashed lines indicate the threshold, 0.25 µm2/s, used for coarse-graining larger models to a two-state model. All datasets are also shown in Supplementary Data 4–7. n = 179569, 115349, 161623, and 191950 trajectory steps collected from 3, 3, 7, and 6 independent experiments for L9, H98, S2, and h6 labelling, respectively. Source data are provided as a Source Data file.

