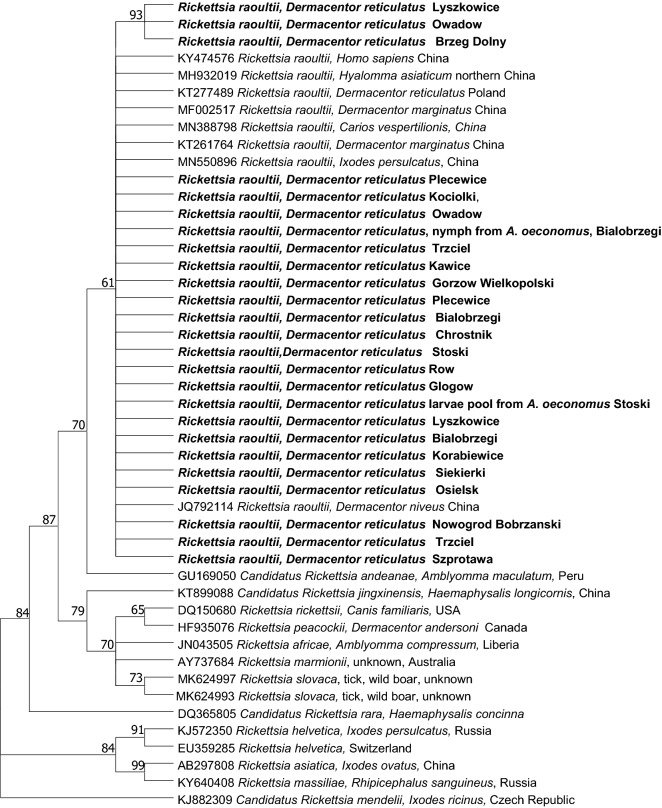
Figure 2.
Molecular phylogenetic analysis of a 750 bp fragment of the citrate synthase (gltA) gene of Rickettsia raoultii. The evolutionary history was inferred by using the Maximum Likelihood method and Hasegawa-Kishino-Yano model. The tree with the highest log likelihood (− 1924.77) is shown. The percentage of trees in which the associated taxa clustered together is shown next to the branches. Initial tree(s) for the heuristic search were obtained automatically by applying Neighbor-Join and BioNJ algorithms to a matrix of pairwise distances estimated using the Maximum Composite Likelihood (MCL) approach, and then selecting the topology with superior log likelihood value. A discrete Gamma distribution was used to model evolutionary rate differences among sites (5 categories (+G, parameter = 0.3308)). This analysis involved 58 nucleotide sequences. There were a total of 703 positions in the final dataset.

