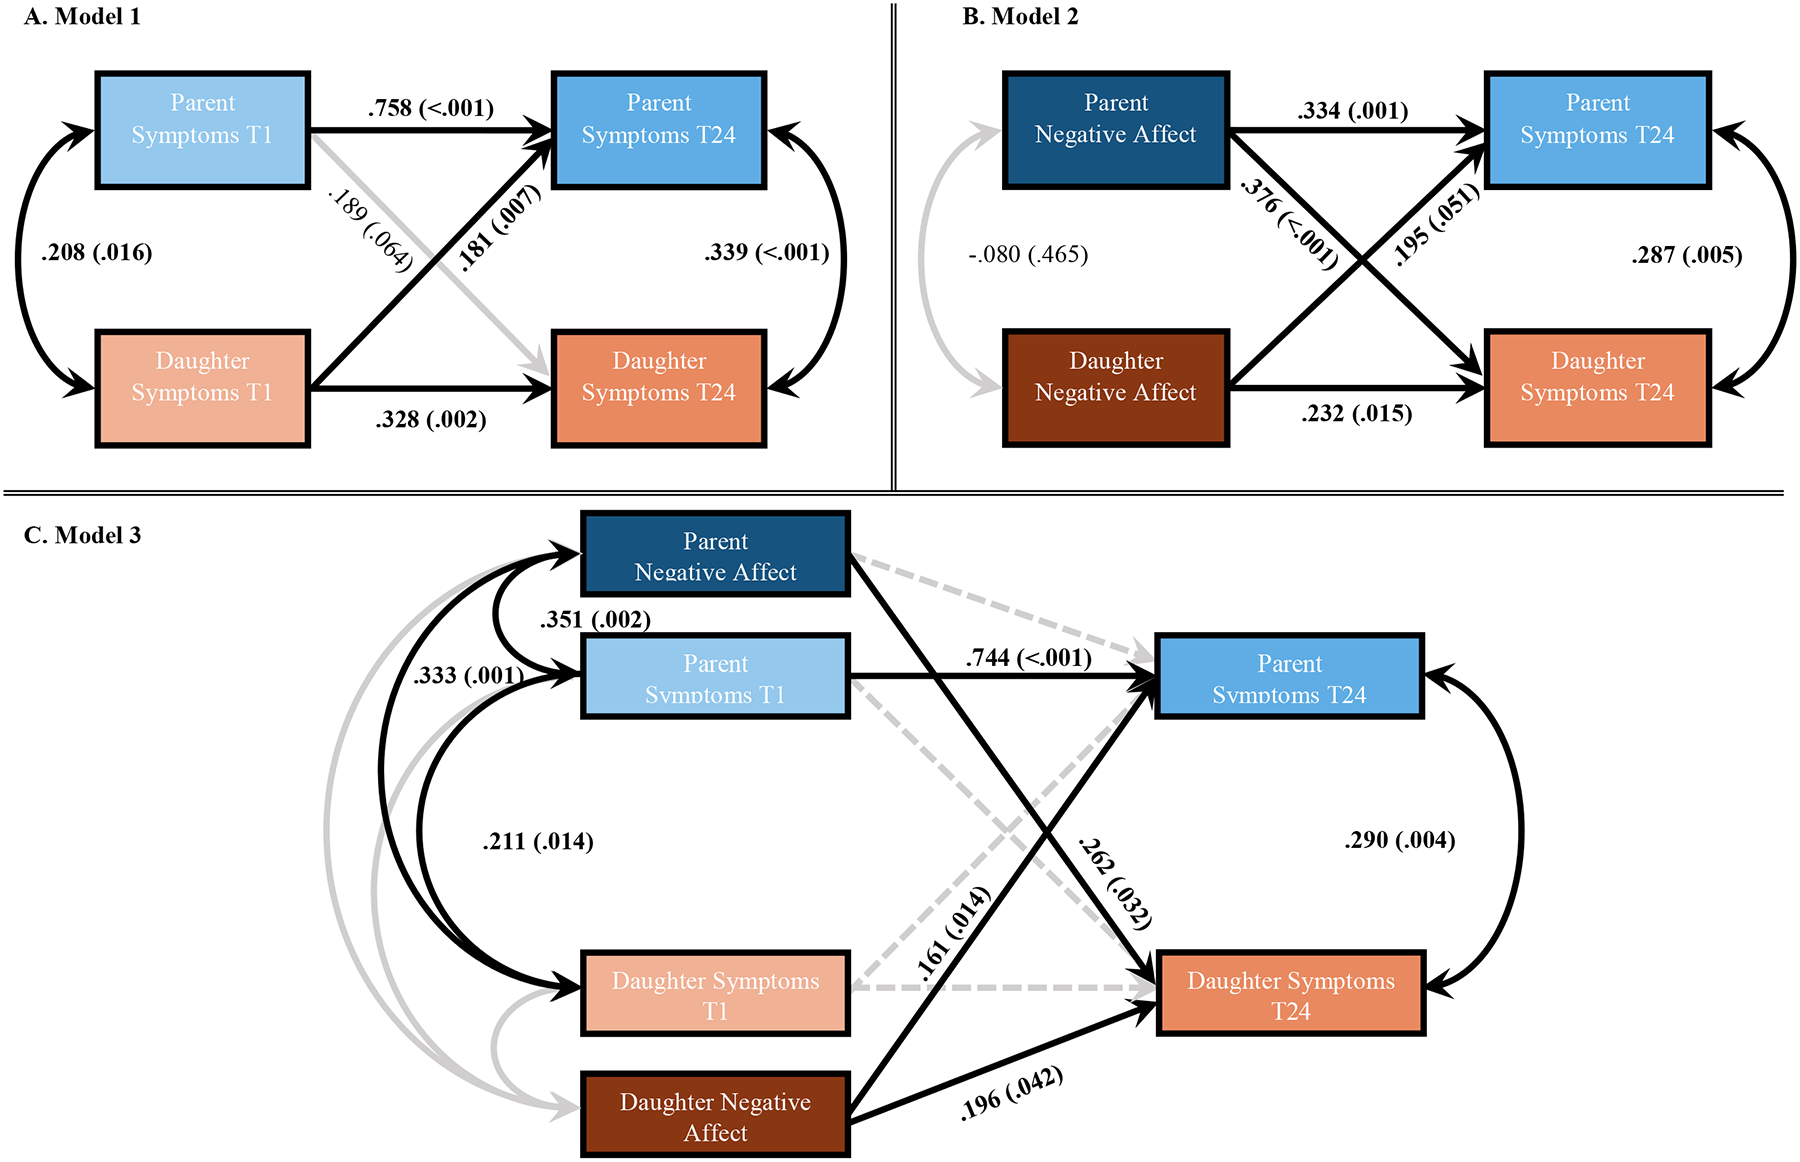
Figure 1.

Actor-Partner Interdependence Models (APIM) with standardized coefficients and p-values.
Note. T1=baseline and T24=24-mo follow-up; Solid black lines represent significant paths; Solid grey lines represent non-significant paths; Dashed grey lines represent paths that were significant in Model 1 or 2 but were non-significant in Model 3.
