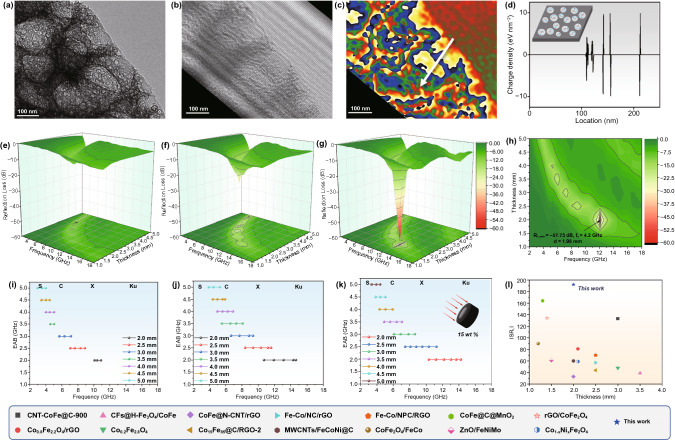
Fig. 2.
Nanodomain variable capacitors and electromagnetic wave (EW) attenuation performance. a‑b HR-TEM and corresponding hologram images. c Charge density map. d Charge density profile along the white arrow and scheme of nanodomain variable capacitors (insert). e‑g The electromagnetic parameters, 3D RL values of Fe@PCS, Co@PCS, and CoFe@PCS. h 2D RL projection of CoFe@PCS. i-k Effective absorption bandwidth (< –10 dB) of Fe@PCS, Co@PCS, and CoFe@PCS. l EW-absorbing performance comparison of CoFe@PCS with other CoFe-based materials (see Table S2 in supporting information)

