Figure 1.
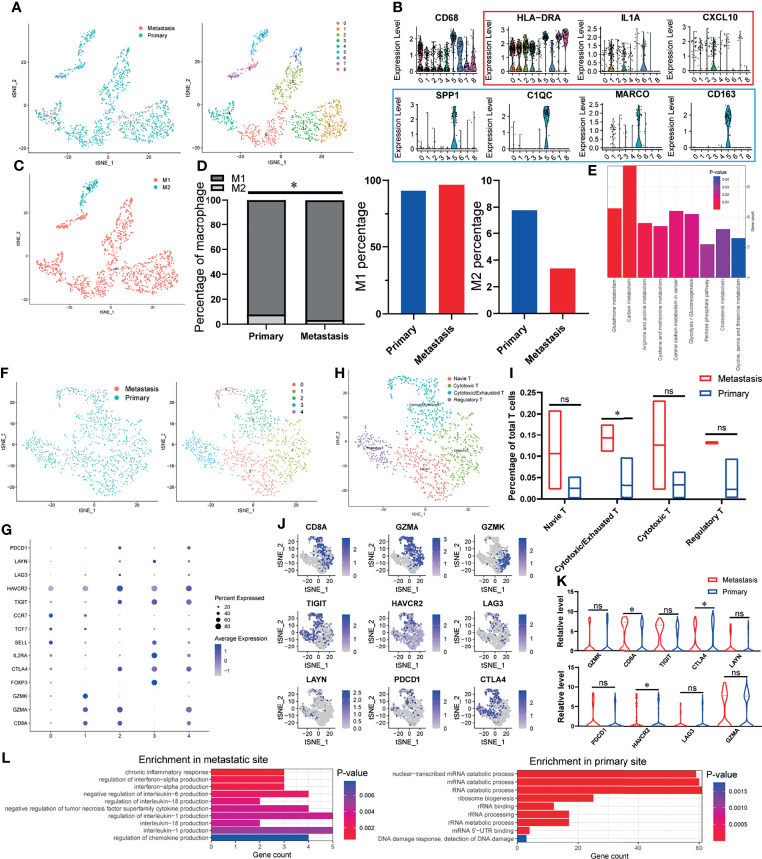
The TIME of OSCC at the site of lymph node metastasis is enriched with classical activated macrophages (M1 macrophages) and cytotoxic T cells. (A) tSNE algorithm is used to divide macrophages into eight clusters. (B) Violin plot shows the expression of canonical M1 macrophages (red) and M2 macrophages (blue) marker genes in all the macrophages (CD68-expressing cells). (C) The eight clusters of macrophages are defined as M1 and M2 macrophages. (D) Specific content of M1 and M2 macrophages at primary and metastatic sites. (E) DEGs-enriched KEGG pathways macrophages between primary and metastatic sites. (F) tSNE algorithm is used to divide T cells into five clusters. (G) The bubble chart shows the marker genes of cytotoxic T cells (CD8A, GZMA, GZMK), regulatory T cells (FOXP3, IL2RA, CTLA4), naive T cells (SELL, TCF7, CCR7), and exhausted T cells (TIGIT, HAVCR2, LAG3, LAYN, PDCD1, CTLA4). (H) All fi e clusters of T cells are annotated according to the composition of the marker genes. (I) The proportions of T-cell subtypes in metastatic and primary sites. (J, K) Expression of cytotoxic and exhausted T cells’ marker genes at metastatic and primary sites. (L) Enriched GO functions of upregulated genes in T cells at metastatic and primary sites. *P < 0.05, ns means no significance.

