Figure 3.
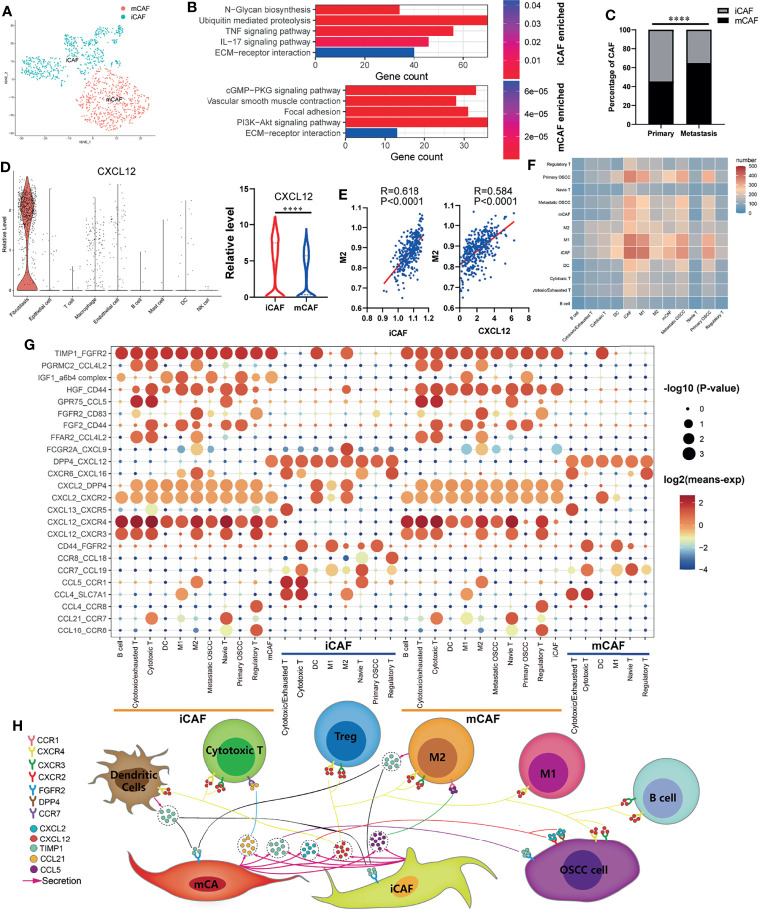
Cell–cell communication network in OSCC TIME. (A) Cancer-associated fibroblasts (CAFs) of OSCC are annotated as inflammatory cancer-associated fibroblasts (iCAFs) and myo-cancer-associated fibroblasts (mCAFs) according to their characteristic marker genes. (B) Enriched KEGG pathways of upregulated genes in iCAFs and mCAFs. (C) Percentage content of MCAF and ICAF in metastatic and primary sites. (D) Expression levels of CXCL12 in various types of cells. (E) Correlation analysis between iCAFs content, CXCL12 expression, and M2 macrophages infiltration level. (F) Heatmap showing the number of potential ligand–receptor pairs between all types of cells predicted by CellphoneDB2. (G) Using bubble plots to exhibit ligand–receptor pairs of growth factors and cytokines between iCAFs/mCAFs and other cell groups. (H) Predicted cell–cell communication network centered on iCAFs and mCAFs. ****P < 0.0001.

