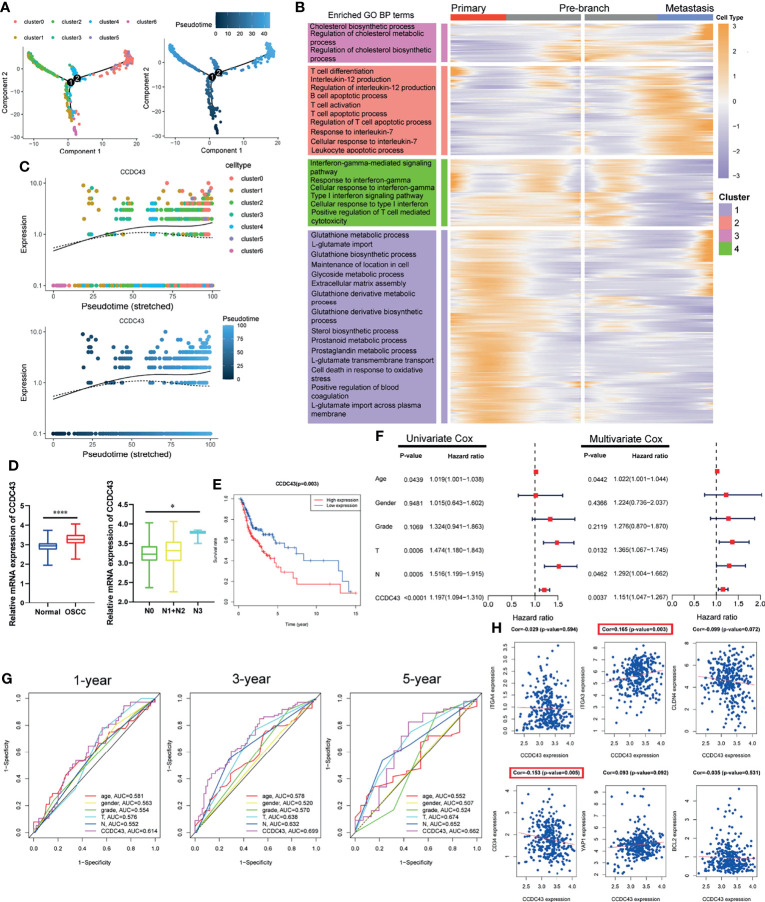
Figure 4.
Pseudotime trajectory and clinical prognosis analysis revealed the important clinical prognostic significance of CCDC43. (A) Pseudo-trajectory and cell source transition of OSCC cells. (B) Heatmap exhibits the gene expression dynamics of OSCC cells group. Genes (rows) are clustered, and cells (columns) are ordered according to the pseudotime development. (C) Jitter plots showing the expression level of CCDC43 changing with pseudotime. (D) TCGA data set showing that CCDC43 expression is significantly increased in OSCC samples (compared with normal samples) and lymph node metastasis samples (compared with primary samples). (E) Survival analysis showing that overexpression of CCDC43 significantly worsens the survival outcome of OSCC patients. (F) Univariate and multivariate Cox hazards analysis of CCDC43, age, gender, grade, T stage, and N stage. (G) Time-dependent ROC curve showing the area under curve (AUC) of CCDC43, age, gender, grade, T stage, and N stage for 1, 3, and 5 years. (H) Correlation analysis of CCDC43 and classic OSCC markers (ITGA4, ITGA3, CLDN4, CD34, YAP1, BCL2). *P < 0.05, ****P < 0.0001.

