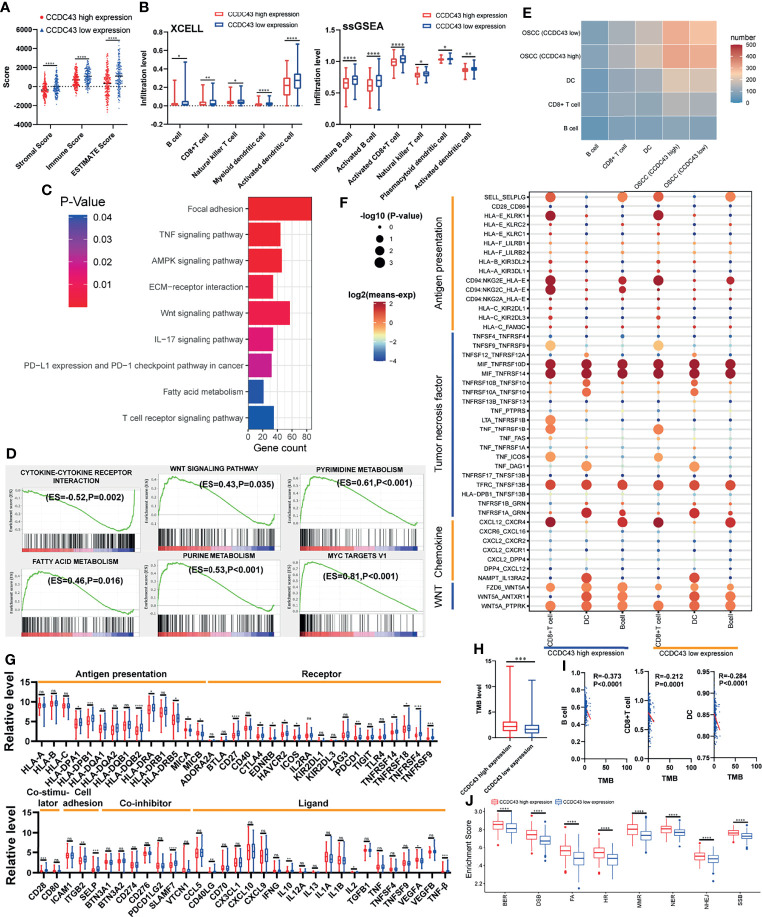
Figure 5.
Correlation between CCDC43 expression and immune characteristics and tumor immunogenicity. (A) ESTIMATE algorithm calculating the immune score, stromal score, and ESTIMATE score of the group with high and low expression of CCDC43. (B) Using XCELL database and ssGSEA algorithm to analyze the correlation between CCDC43 and immune cells infiltration. (C, D) Using KEGG and GSEA to annotate the function of CCDC43. (E) Heatmap showing the number of potential ligand–receptor pairs between OSCC cells with high-/low-expression CCDC43 and B cell, CD8+ T cell, and dendritic cell (DC). (F) Using bubble plots to exhibit ligand–receptor pairs of antigen-presentation-associated molecules, tumor necrosis factor, chemokine, and WNT signaling pathway-associated molecules between high/low CCDC43 expression OSCC cells and immune cells (CD8+ T cell, DC, and B cell). (G) Box diagram depicting the expression level of immune-related genes between CCDC43 high- and low-expression group. Red represents CCDC43 high-expression group, and blue represents CCDC43 low-expression group. (H) Analysis of the association between CCDC43 expression and tumor mutation load (TMB). (I) Correlation analysis of TMB and the infiltration level of B cell, CD8+ T cell, and DC. (J) The enrichment of DNA damage repair-related gene set between CCDC43 high- and low-expression group. *P < 0.05, **P < 0.01, ***P < 0.001, ****P < 0.0001, ns means no significance.

