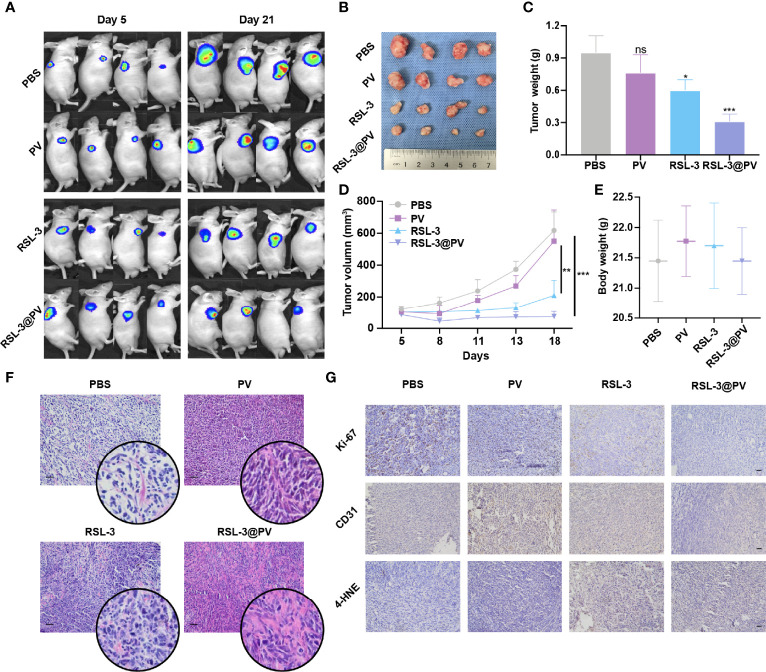
Figure 4.
Antitumor activity of RSL-3@PVs. (A) Fluorescence images of tumors at day 5 and day 21 after injection of the indicated formulations into PDAC xenograft nude mice (n = 4). (B) Representative images of tumors excised at the end of the experiment (n = 4). (C) The volumes of tumors collected at the end of treatment (n = 4). (D) Tumor growth curves of PDAC xenograft BALB/c nude mice treated with the indicated formulations (n = 4). (E) The body weights of mice measured at the end of treatment (n = 4). (F) H&E staining of the dissected tumor tissues in the indicated treatment group. Scale bars, 100 μm. (G) Ki-67, CD31 and 4-HNE staining of the dissected tumor tissues in the indicated treatment group. Scale bars, 100 μm. Error bars represent the mean ± s.d. Student’s t test or one-way ANOVA was used for comparison between two groups or among multiple groups, ns P > 0.05, *P < 0.05, **P < 0.01, and ***P < 0.001.

