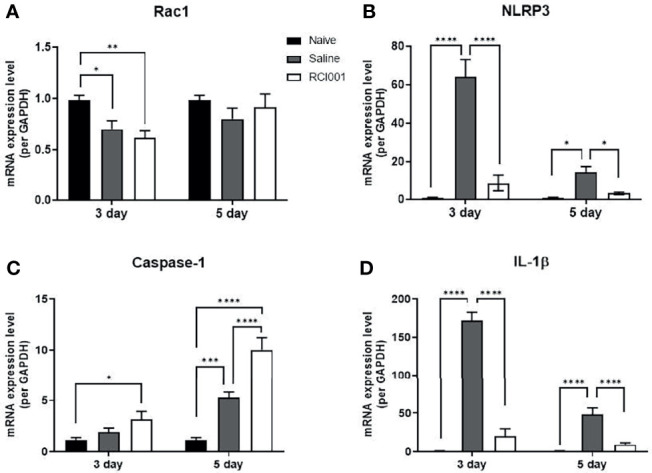
Figure 5.

RCI001 inhibited activation of Rac1 and NLRP3-caspase-1-IL-1β pathway of ocular surface in the ocular alkali burn model measured by RT-PCR. Relative mRNA expression levels of Rac1 (A), NLRP3 (B), caspase-1 (C), and IL-1β (D). Data are presented as means ± standard error of the mean (SEM). *p<0.05, **p<0.01, ***p<0.001, and ****p<0.0001. IL-1β, interleukin-1β.
