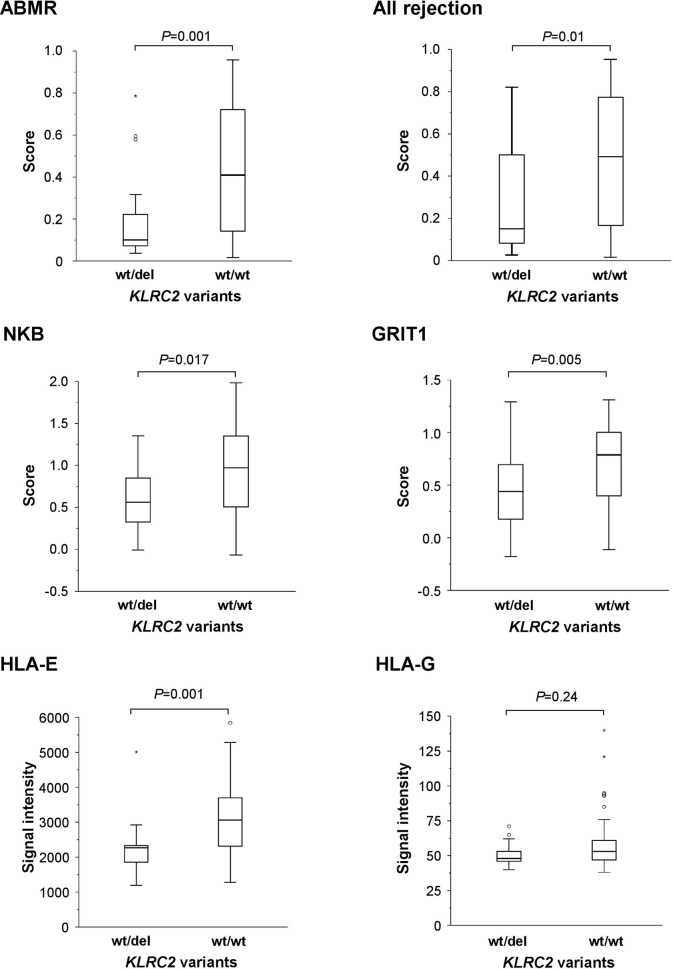
Figure 3.
KLRC2 polymorphism in the DSA+ BORTEJECT cohort in relation to molecular rejection-related scores (ABMR, ‘all rejection’), NK cell burden (NKB)- and IFN-y-related transcripts (GRIT1), or expression of HLA-E and HLA-G (microarray signal intensity). Box plots represent the median, interquartile range and range. Outliers are indicated by circles and extreme outliers by asterisks.

