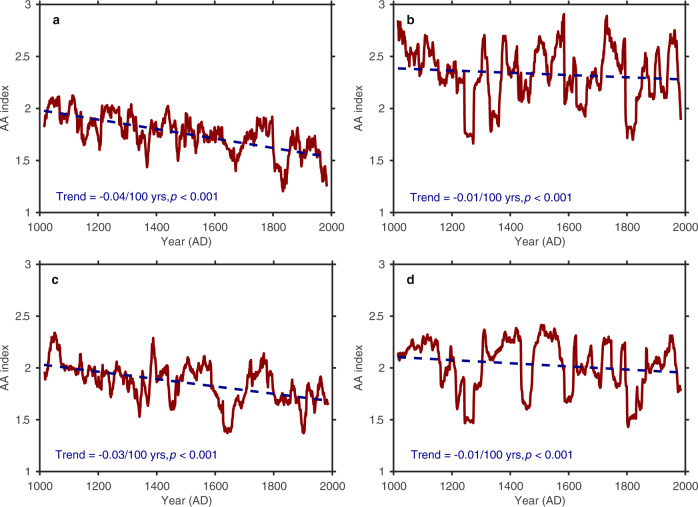
Fig. 3. The reconstructed AA indices and estimated AA trends during the past millennia derived from three PDA-based reconstructions and the mean of CMIP5 multi-model simulations.
a PDA-based reconstruction of this study. b Goosse2012. c Steiger2018. d Multi-model mean. The dark red solid line represents the AA index derived from PDA-based reconstructions or the mean of CMIP5 multi-model simulations, and the dark blue dotted line is the long-term trend. The AA index values were computed based on annual temperature anomalies without smoothing with respect to the mean for 1961–1990. The long-term trends were computed via Mann-Kendall trend detection (see Methods) for each AA index time series.

