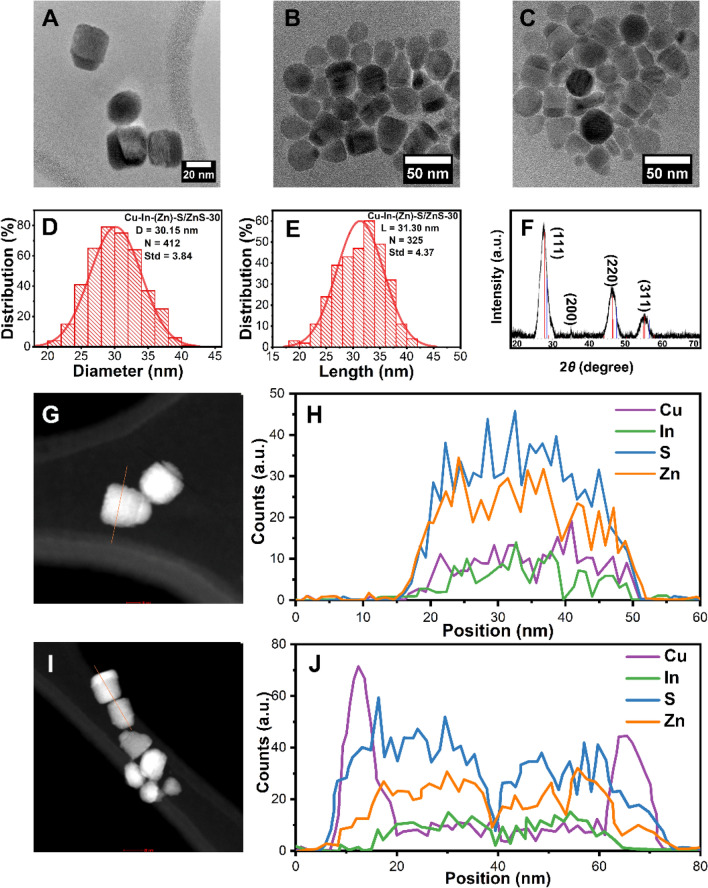
Figure 2.
(A–C) TEM images, (D) Diameter histogram, (E) Length histogram and (F) XRD diffraction pattern (The red and blue lines indicate the reference PDF 47-1372 CuInS2 and PDF 65-1691 ZnS, respectively) of the sample Cu–In–(Zn)–S/ZnS-30. (G,H) STEM image and corresponding line scanning spectra following the direction of the orange line in (G). (I, J) STEM image and the corresponding line scanning spectra of the orange line in (I).

