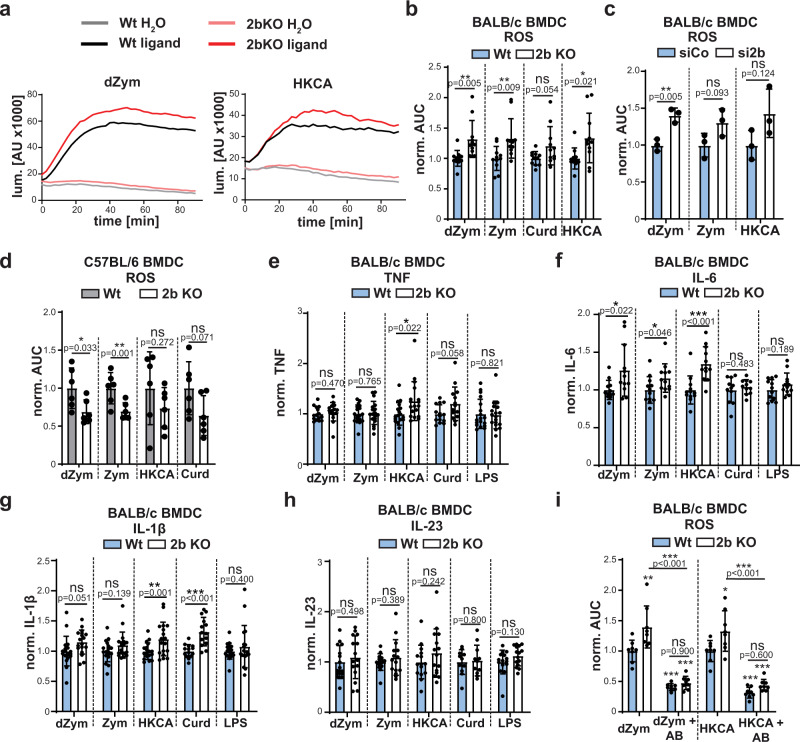
Fig. 5. SPPL2b regulates ROS production in response to Dectin-1 ligands.
a BMDCs from BALB/c wild type (Wt) or SPPL2b knockout (2b KO) mice were treated with 50 µg/ml depleted Zymosan (dZym) or MOI 10 heat-killed C. albicans (HKCA). ROS formation was detected using the luminometric L-012 probe. The graphs depict a representative experiment. N = 3, n = 11. b Quantification of ROS formation from experiment shown in a) based on Area under the curve (AUC) calculation. Cells were stimulated with either 50 µg/ml dZym, 50 µg/ml Zym, MOI 10 HKCA or 200 µg/ml Curdlan. N = 3, n = 11. Two-tailed unpaired Student’s t test. c ROS analysis was performed in wild type BALB/c BMDC transfected with either control or SPPL2b-targeting siRNA. N = 1, n = 3. Two-tailed unpaired Student’s t test. d ROS formation was analysed in Wt or 2b KO C57BL/6 BMDC upon treatment with either 50 µg/ml dZym, 50 µg/ml Zym, MOI 10 HKCA or 200 µg/ml Curdlan. N = 2, n = 6. Two-tailed unpaired Student’s t test. e–h Wild type or SPPL2b-/- BMDC were treated for 24 h with either 50 µg/ml dZym, 50 µg/ml Zym, MOI 10 HKCA, 200 µg/ml Curdlan (Curd) or 500 ng/ml LPS as control. Finally, levels of TNF (e), IL-6 (f), IL-1β (g) or IL-23 (h) in the conditioned medium were measured by ELISA. TNF: Curd: N = 4, n = 14, dZym: N = 4, n = 15; others N = 5, n = 18. IL-6: Curd: N = 3, n = 11, rest N = 4, n = 12. IL-1β: Curd: N = 4, n = 14; rest N = 5, n = 18. IL-23: Curd: N = 3, n = 11, rest N = 4, n = 15. Two-tailed Unpaired Student’s t test. i Prior to stimulation with either 50 µg/ml dZym or MOI 10 HKCA, wild type or SPPL2b-deficient BMDC were incubated with 10 µg/ml anti-Dectin-1 blocking antibody (AB) for 30 min. Subsequently, ROS production was determined. N = 2, n = 8. One-Way ANOVA with Tukey’s post hoc test. p values from statistical testing for comparison of each condition to wild type control samples (from left to right) are: dZym: p = 0.0031, p < 0.0001, p < 0.0001; HKCA: p = 0.9747, p = 0.2621, p > 0.0001. All diagrams depict Mean values ± SD.

