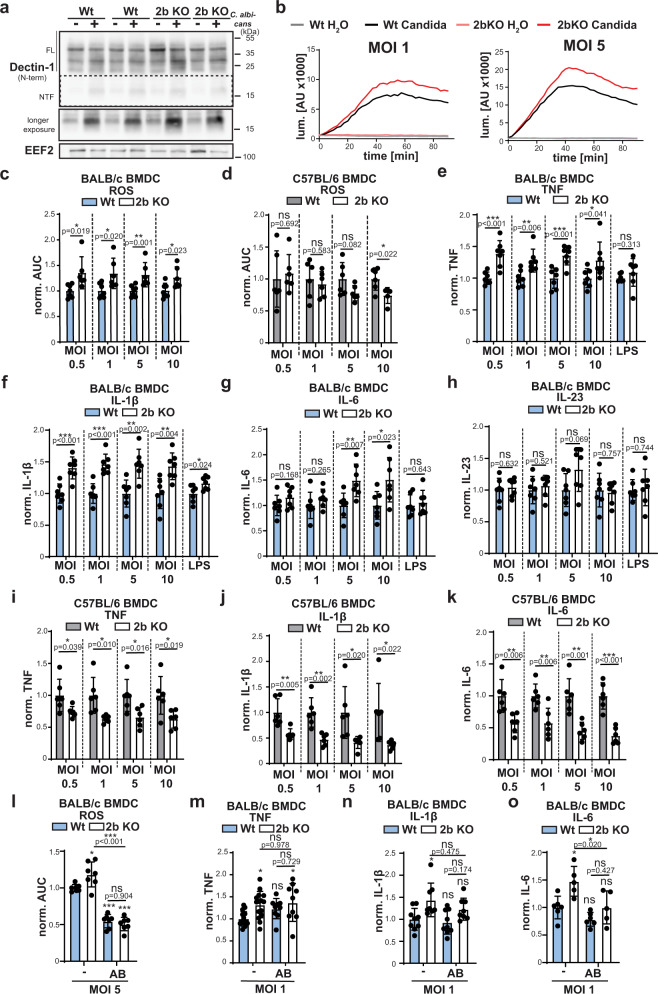
Fig. 6. SPPL2b controls the response of BMDC to Candida albicans.
a Either wild type (Wt) or SPPL2b-deficient (2b KO) BALB/c BMDC were treated for 6 h with MOI 10 living C. albicans and analysed by western blotting for processing of Dectin-1. Full length (FL) Dectin-1 and the corresponding N-terminal fragment (NTF) are indicated. N = 2, n = 4. b Either Wt or 2b KO BMDC were stimulated for 90 min with viable C. albicans in the indicated MOIs. ROS formation was measured using the luminescent probe L-012. ROS curves of cells from representative individual animals are shown. N = 2, n = 6 (Wt) or 7 (2b KO). c Wt or 2b KO BALB/c BMDC were treated with living C. albicans in the indicated MOIs and analysed for ROS formation. ROS production was quantified based on area under the curve (AUC) calculation. N = 2, n = 6 (Wt) or 7 (2b KO). Two-tailed unpaired Student’s t test. d The same experiment was conducted with BMDC from Wt or 2b KO mice on C57BL/6 background. N = 2, n = 5 (2b KO MOI 10) or n = 6 (rest). Two-tailed unpaired Student’s t test. e–h Wt or 2b KO BMDC were treated for 24 h with viable C. albicans in the indicated MOIs or 500 ng/ml LPS and assayed for production of TNF (e), IL-1β (f), IL-6 (g) or IL-23 (h) by ELISAs. N = 2, n = 7 in all cases. Two-tailed unpaired Student’s t test. Levels of TNF (i), IL-1β (j) and IL-6 (k) were also assessed in supernatants of equivalently treated BMDC with the same genotypes but on C57BL/6 background. N = 2, n = 6 in all cases. Two-tailed unpaired Student’s t test. l Wt or 2b KO BMDC (Balb/c background) were pretreated with 10 µg/ml Dectin-1 blocking antibody (AB) and then stimulated with living C. albicans yeasts (MOI 1). ROS formation was analysed using the luminometric L-012 probe. N = 3, n = 7. One-Way ANOVA with Tukey’s post hoc testing. p values from statistical testing for comparison of each condition to wild type control samples (from left to right) are: p = 0,0214, p < 0.0001, p < 0.0001. m–o BMDC from either Wt or 2b KO BALB/c mice incubated with anti-Dectin-1 (10 µg/ml) for 30 min prior to stimulation with living C. albicans yeast for 24 h. Levels of TNF (m), IL-1β (n) and IL-6 (o) in the media were measured by ELISA TNF: no blocking: N = 5, n = 15, blocking N = 3, n = 9. IL-1β: Wt: N = 3, n = 9, 2b KO: N = 3, n = 8. IL-6: Wt: N = 3, n = 9, 2b KO N = 3, n = 8. One-way ANOVA with Tukey’s post hoc test. p values from statistical testing for comparison of each condition to wild type control samples (from left to right) are: TNF: p = 0.0163, p = 0,2253, p = 0,017; IL-1β: p = 0.0195, p = 0.9592, p = 0,3809; IL-6: p = 0.0142, p = 0.3894, p > 0.999. All diagrams depict Mean values ± SD. ns not significant; *p ≤ 0.05; **p ≤ 0.01; ***p ≤ 0.001.

