
Fig. 3. Example of how the Waffle Method solves low concentration, low-throughput, and preferred orientation problems of conventional cryo-FIB/SEM of microsporidian spores.
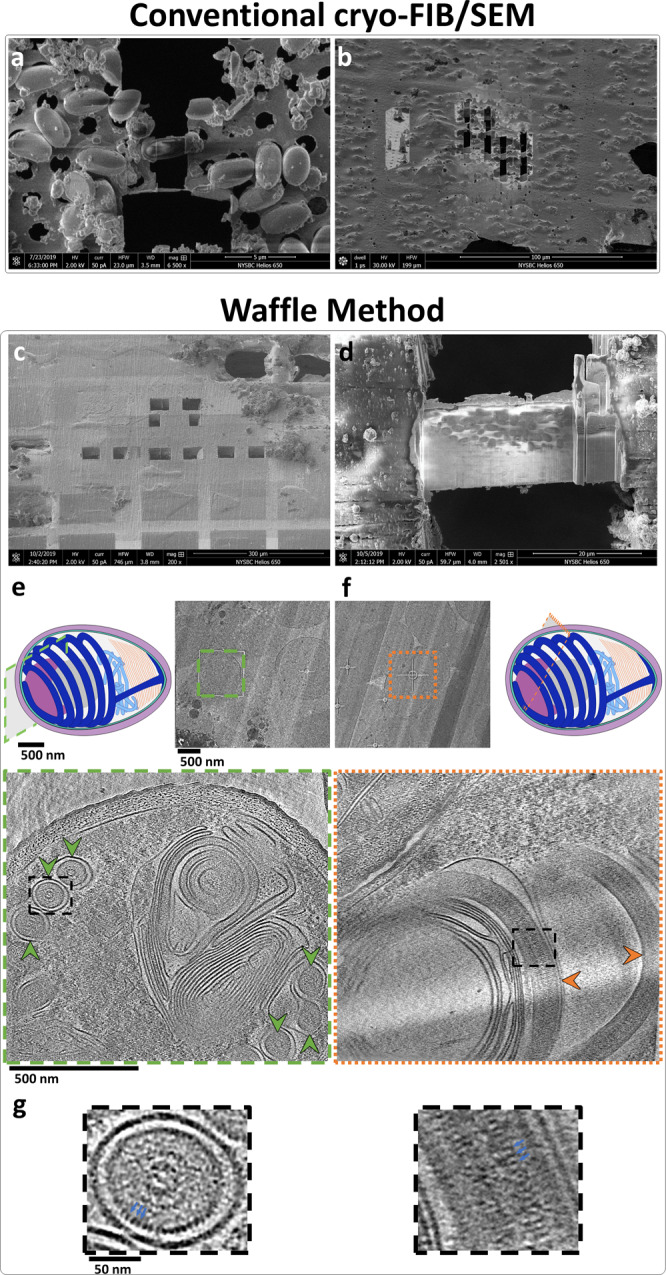
a, b Small cells milled by conventional cryo-FIB/SEM where the samples were back-blotted and plunge frozen. The cells are individually-milled due to low concentration, leading to low-throughput. a SEM image of an individually-milled cell (~1.5 × 3 μm). b FIB image of several individually-milled cells. c–g Small cells prepared using the Waffle Method. c SEM image of a waffle with several trenches prepared. d SEM image of a completed waffle lamella (~30 × 20 μm) with a notch mill showing several orientations of the spores. e A low-mag TEM image of a waffled microsporidian spore lamella alongside a schematic diagram of a spore with the high-mag cryo-ET collection area approximated (green outlined cross-section). Below is a slice-through of the high-mag tomogram with arrows showing axial views of the polar tube in the spore (green arrows). The polar tube in the schematic diagram is colored dark blue, exhibiting a fixed orientation relative to the major axis of the spore. f A low-mag TEM image of a waffled microsporidian spore lamella alongside a schematic diagram of a spore with the high-mag cryo-ET collection area approximated (orange outlined cross-section). The spore cross-section is roughly orthogonal to the spore in e, as the diagrams show. Below is a slice-through of the high-mag tomogram with arrows showing side views of the polar tube in the spore (orange arrows). g The dashed black line insets in e and f magnified by 4x highlighting the ~2.5 nm features on the second cylindrical layer (blue arrows). Tomogram slice-through movies are shown in Supplementary Movie 3. a, c–g show E. hellem microsporidian spores while (b) shows A. algerae microsporidian spores. n > 25 independent cells observed in various orientations in tomograms.