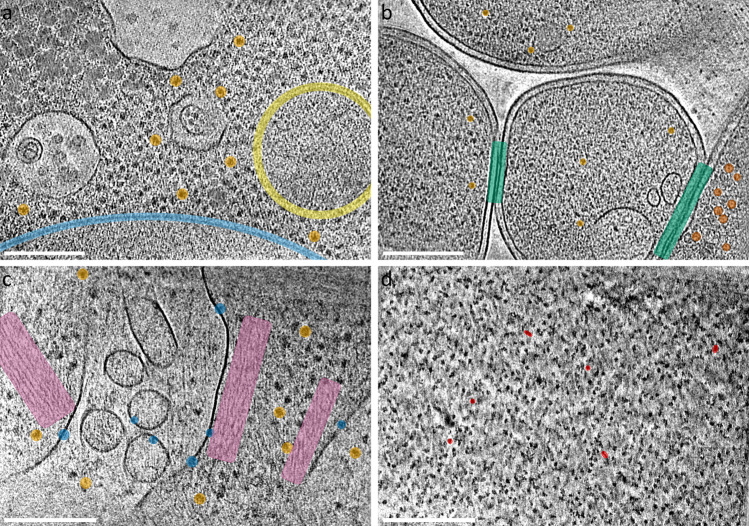
Fig. 4. Additional examples using the Waffle Method.
Tomogram slice-through of: a of yeast S. cerevisiae with several ribosomes (orange), potential mitochondria (yellow), and the nuclear envelope (light blue) highlighted; b E. coli BL21 (DE3) + Leviviridae PP7-PP7 virus capsid proteins with several virus capsids (red-orange), ribosomes (orange), and neighboring cell-cell membranes (green) highlighted; c HEK 293 S GnTI- with several transmembrane proteins (blue), ribosomes (orange), and actin networks (purple) highlighted; and d porcine thyroglobulin (ThG) single particle waffle lamellae with several orientational views highlighted (red). Scale bars are 200 nm. Each slice shown is about 8 Å thick. n > 25 a, 35 b, 5 c, and 10 d independent tomograms.

