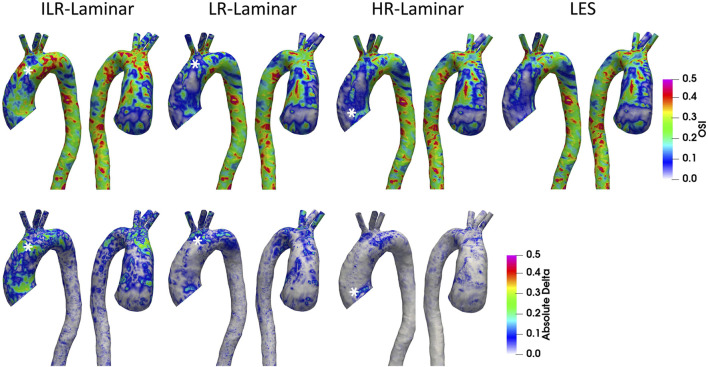
FIGURE 11.
Top row: Oscillatory shear index (OSI) contours for ILR-Laminar, LR-Laminar, HR-Laminar and LES simulations. Bottom row: Absolute difference in OSI values for ILR-, LR- and HR-Laminar simulations, relative to the LES simulation. Locations of largest differences are indicated with asterisks.

