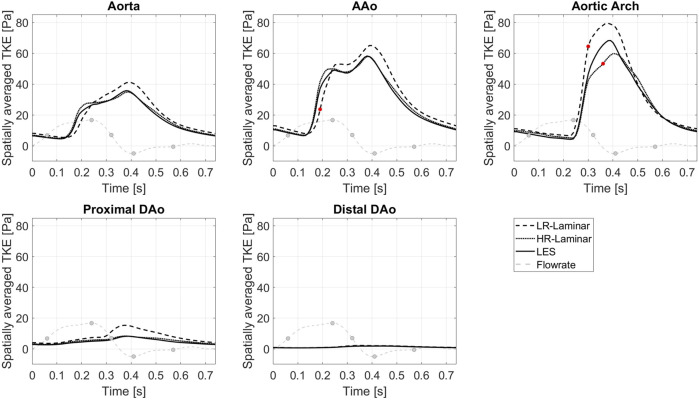
FIGURE 4.
TKE spatially averaged over the entire aorta and each ROI, plotted over the cardiac cycle. Largest differences relative to LES are indicated by red markers. Key times throughout the cardiac cycle are indicated by grey markers and refer to maximum acceleration, peak systole, maximum deceleration, end systole and mid-diastole.

