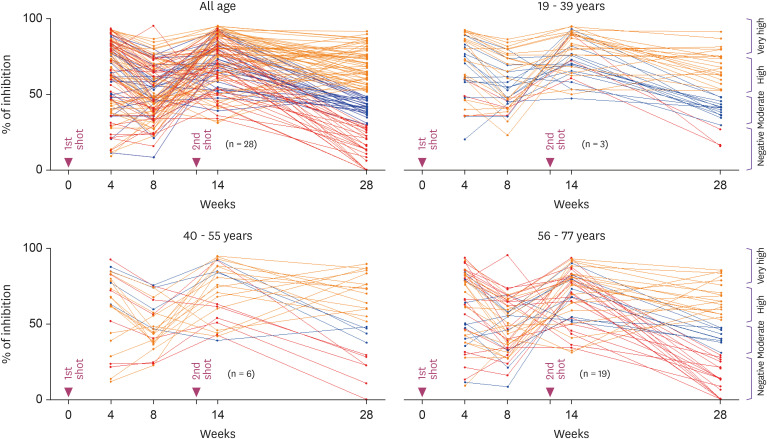
Figure 2. The time course of the measured values of Nab titers (inhibition %) for all vaccinated individuals. For ease of viewing, a merged line graph with all age groups was separated into 3 ages groups of 19 - 39, 40 - 55 and 56 - 77 years. In the 28-week group, subjects with inhibition% of less than 30.0% (red), 31.0 – 50.0% (blue) and >51.0% (orange) are indicated by different color lines.
Nab, neutralizing antibody.

