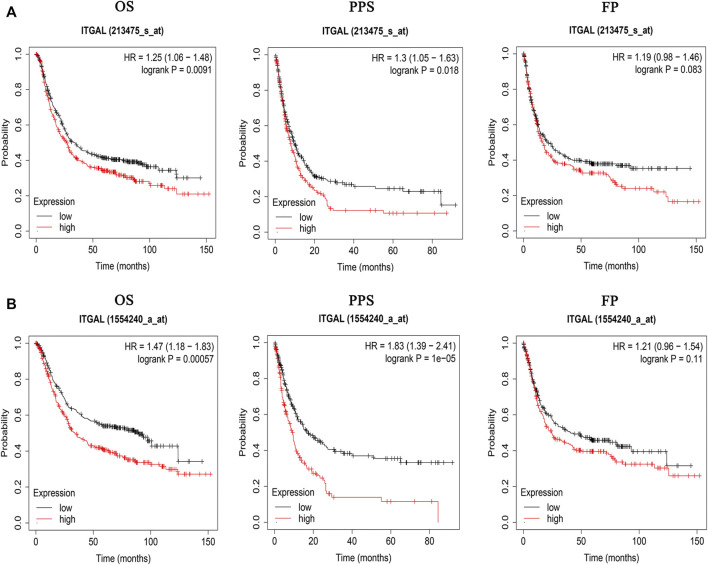
FIGURE 3.
Kaplan–Meier survival curves comparing the high and low expression of ITGAL in gastric cancer in Kaplan–Meier plotter databases. (A) Survival curves of OS, PPS, and FP in the gastric cancer cohort (213475-s-at). (B) OS, PPS, and FP survival curves of gastric cancer (1554240-a-at). OS, overall survival; PPS, post-progression survival; FP, first progression.

